MiroTalk SFU — Node.js heap out of memory crash (OOM) + analysis

-
Hi everyone,
Last night our MiroTalk SFU instance (v2.1.26, running on Cloudron) crashed due to a Node.js
out-of-memory error. I wanted to share my analysis in case others run into the same issue.BTW: there was NOTHING in the Cloudron GUI log:
Time	Source	Details
11 mrt 2026, 02:02	cron	App was updated to v2.6.10
11 mrt 2026, 02:00	cron	Update started from v2.6.9 to v2.6.10
What happened
Around 04:40 UTC the container crashed hard with the following fatal error:FATAL ERROR: Reached heap limit Allocation failed - JavaScript heap out of memory Aborted (core dumped)The Node.js process had been running for approximately 27.5 hours (~99,000 seconds according
to the GC log). At the time of the crash, the heap was sitting at ~251 MB with no room left
to grow. Cloudron's healthcheck detected the crash viaECONNREFUSEDand automatically
restarted the container. After the restart at 04:41 UTC the app came back up normally.
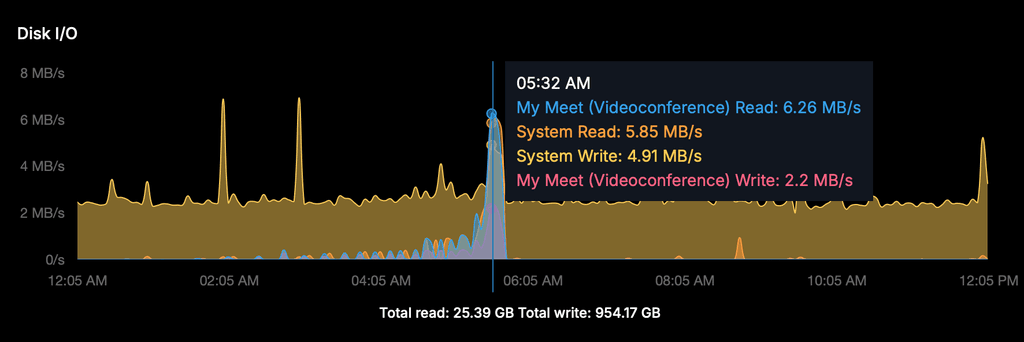
Disk I/O spike
The Disk I/O graph showed a sharp spike around the time of the crash and restart:
- MiroTalk Read: 6.26 MB/s
- System Read: 5.85 MB/s
- System Write: 4.91 MB/s
- MiroTalk Write: 2.2 MB/s
This is consistent with Docker rebuilding the container, writing the core dump, and reloading
all Node modules on startup. The background system writes (~2 MB/s) throughout the night
appear normal (likely backups/log rotation).
Probable causes
-
Memory leak — the process grew steadily over ~27.5 hours until the heap was exhausted.
This pattern is typical of a slow memory leak in the application itself. -
Insufficient heap size — with 10 mediasoup workers configured, the default Node.js
heap limit can be too low under sustained load. -
OIDC discovery errors as a contributing factor — just before the crash, the logs show
repeatedIssuer.discover() failederrors because the OIDC provider (issuerBaseURL)
was temporarily unreachable. Repeated failed discovery attempts can accumulate error
objects and contribute to heap pressure.
AggregateError: Issuer.discover() failed.
OPError: expected 200 OK, got: 404 Not Found
RequestError: Timeout awaiting 'request' for 5000ms
Recommendations
Short term: Increase the Node.js heap limit by setting the following environment variable
in your MiroTalk configuration:NODE_OPTIONS=--max-old-space-size=2048Monitoring: Keep an eye on RAM usage over time. If memory grows steadily without ever
dropping, that confirms a leak in the app that should be reported upstream to the MiroTalk
developer.OIDC stability: Make sure the OIDC provider endpoint is reliably reachable. On Cloudron
this appears to be the built-in auth (/openid). If discovery requests fail repeatedly and
are not properly cleaned up, they may contribute to memory growth.
Environment
Property Value MiroTalk SFU v2.1.26 Node.js 22.14.0 Workers 10 Server RAM 62.79 GB OS Linux 5.15.0 x64 Platform Cloudron (Docker container)
Has anyone else seen this OOM pattern with MiroTalk SFU? Curious whether it's related to a
specific feature (OIDC, recording, etc.) or just general heap growth over time. -
Hi everyone,
Last night our MiroTalk SFU instance (v2.1.26, running on Cloudron) crashed due to a Node.js
out-of-memory error. I wanted to share my analysis in case others run into the same issue.BTW: there was NOTHING in the Cloudron GUI log:
Time	Source	Details
11 mrt 2026, 02:02	cron	App was updated to v2.6.10
11 mrt 2026, 02:00	cron	Update started from v2.6.9 to v2.6.10
What happened
Around 04:40 UTC the container crashed hard with the following fatal error:FATAL ERROR: Reached heap limit Allocation failed - JavaScript heap out of memory Aborted (core dumped)The Node.js process had been running for approximately 27.5 hours (~99,000 seconds according
to the GC log). At the time of the crash, the heap was sitting at ~251 MB with no room left
to grow. Cloudron's healthcheck detected the crash viaECONNREFUSEDand automatically
restarted the container. After the restart at 04:41 UTC the app came back up normally.
Disk I/O spike
The Disk I/O graph showed a sharp spike around the time of the crash and restart:
- MiroTalk Read: 6.26 MB/s
- System Read: 5.85 MB/s
- System Write: 4.91 MB/s
- MiroTalk Write: 2.2 MB/s
This is consistent with Docker rebuilding the container, writing the core dump, and reloading
all Node modules on startup. The background system writes (~2 MB/s) throughout the night
appear normal (likely backups/log rotation).
Probable causes
-
Memory leak — the process grew steadily over ~27.5 hours until the heap was exhausted.
This pattern is typical of a slow memory leak in the application itself. -
Insufficient heap size — with 10 mediasoup workers configured, the default Node.js
heap limit can be too low under sustained load. -
OIDC discovery errors as a contributing factor — just before the crash, the logs show
repeatedIssuer.discover() failederrors because the OIDC provider (issuerBaseURL)
was temporarily unreachable. Repeated failed discovery attempts can accumulate error
objects and contribute to heap pressure.
AggregateError: Issuer.discover() failed.
OPError: expected 200 OK, got: 404 Not Found
RequestError: Timeout awaiting 'request' for 5000ms
Recommendations
Short term: Increase the Node.js heap limit by setting the following environment variable
in your MiroTalk configuration:NODE_OPTIONS=--max-old-space-size=2048Monitoring: Keep an eye on RAM usage over time. If memory grows steadily without ever
dropping, that confirms a leak in the app that should be reported upstream to the MiroTalk
developer.OIDC stability: Make sure the OIDC provider endpoint is reliably reachable. On Cloudron
this appears to be the built-in auth (/openid). If discovery requests fail repeatedly and
are not properly cleaned up, they may contribute to memory growth.
Environment
Property Value MiroTalk SFU v2.1.26 Node.js 22.14.0 Workers 10 Server RAM 62.79 GB OS Linux 5.15.0 x64 Platform Cloudron (Docker container)
Has anyone else seen this OOM pattern with MiroTalk SFU? Curious whether it's related to a
specific feature (OIDC, recording, etc.) or just general heap growth over time.Has anyone else seen this OOM pattern with MiroTalk SFU? Curious whether it's related to a
specific feature (OIDC, recording, etc.) or just general heap growth over time.Should be done in
MiroTalk SFU v2.1.29. The Docker image build is currently in progress...OOM crash after ~27.5h caused by
auth()being re-created on every HTTP request, triggering OIDC discovery each time. When the OIDC provider went down, error objects flooded memory. Several other slow leaks (transport listeners, dangling timeouts, unbounded arrays) compounded it.Fixed:
- OIDC
auth()middleware now cached (created once, not per-request) - Transport listeners cleaned up on close
- ICE disconnect timeouts properly cancelled
- Presenter entries removed per-peer on disconnect
- One-shot events use
.once()instead of.on() - Banned peers list now has 24h TTL
-
PS: Fix also done in MiroTalk P2P v.1.7.40 and MiroTalk BRO v.1.1.83 - OIDC auth() middleware now cached (created once, not per-request)
-
wow that is fast, Thanks!
Hello! It looks like you're interested in this conversation, but you don't have an account yet.
Getting fed up of having to scroll through the same posts each visit? When you register for an account, you'll always come back to exactly where you were before, and choose to be notified of new replies (either via email, or push notification). You'll also be able to save bookmarks and upvote posts to show your appreciation to other community members.
With your input, this post could be even better 💗
Register Login