n8n / Cloudron Performance Discussion & Best Practice
-
Hey everyone,
I'm currently running an instance of Cloudron with n8n (version 1.107.4) and I'm trying to determine what the best configuration is for performance out of the box since I'm experiencing frequent issues, laggy interface and occasional connection timeouts.
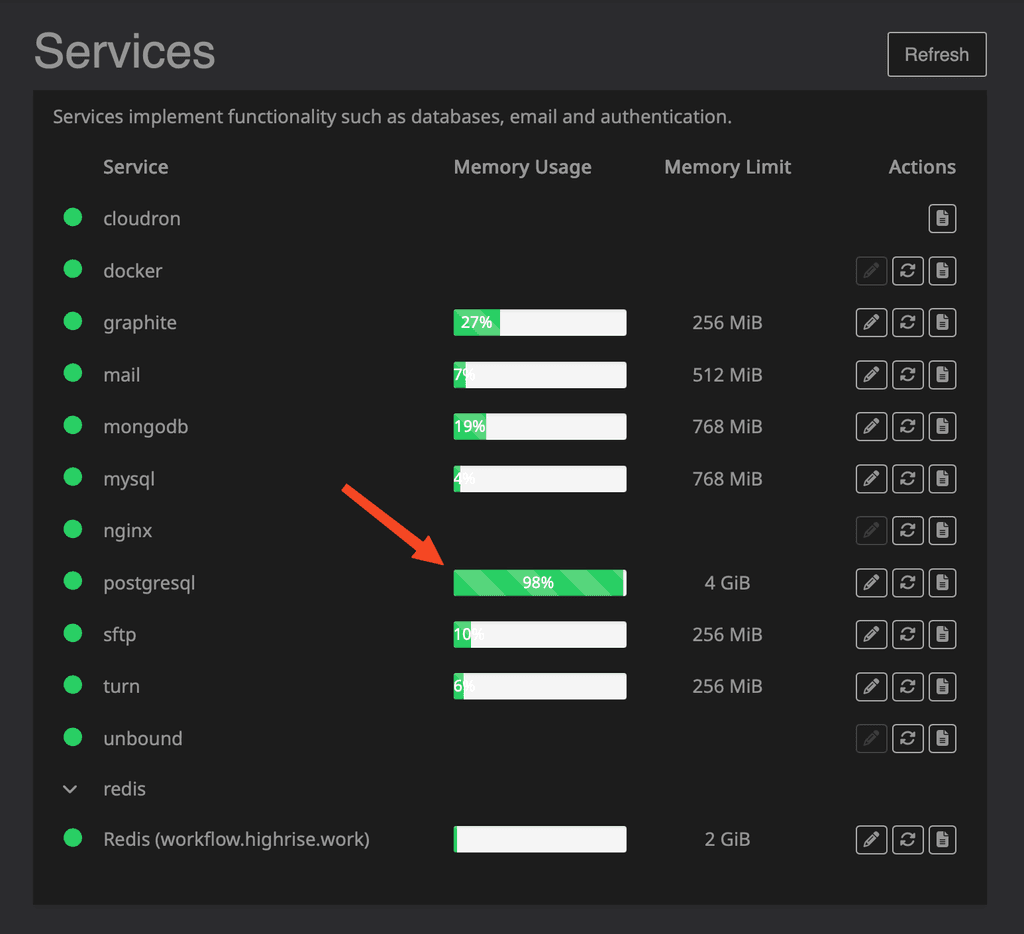
I have an instance with 4 vCPU + 8GB of RAM. By default, it looks like Cloudron allocates 256MB to Postgres and Redis.
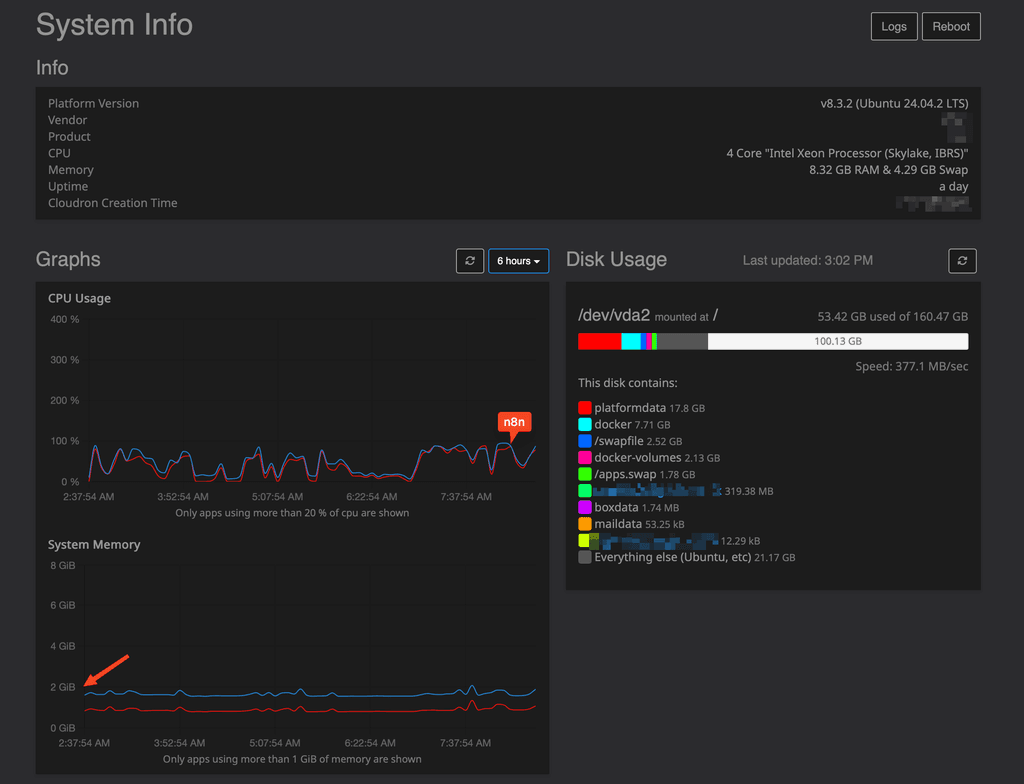
When I run a n8n app, I cannot get it to exceed 100% CPU out of 400% available CPU. The UI frequently locks up when processes are being run - and upon further investigation it looks like Postgres is being maxed.
So I increased memory to 2GB for Postgres and Redis via the services panel in Cloudron. 2GB for Postgres was quickly filled and performance improved a little bit. But Redis use didn't change at all. I'm using whatever configuration n8n is set up for out of the box.
I then pumped Postgres up to 4GB and its currently sitting at 70% again, performance seems to have improved a little bit but I cannot get n8n to use more than 100% CPU of 400%. I've confirmed at the VPS level that only 25% of the CPU is being used. Does anyone know how to get n8n to use more CPU? It is set to 100% in the Resource Panel.
My workflows are relatively simple workflows that use scheduled triggers as well as web hooks. They basically check and/or send emails so the types of nodes I'm using are Outlook, Teams etc. Nothing I would consider to be insanely intensive. I'm also only running about 10 active workflows.
I'm hoping others might find this post and share their thoughts / configurations / tips / tricks etc.
-
By default Cloudron does not restrict CPU usage per app (unless a limit is manually set). So presumably n8n itself is only single-threaded and thus only uses one CPU core at a time. This would mean you would have to increase the single-core performance of your server instead of adding more cores. This depends on the VPS provider in this case then and is likely not related to Cloudron as such.
For redis, I am not sure how n8n uses redis and if that would improve your situation or if they use it for something which isn't your bottleneck.
-
It is not unusual that the memory usage for a service like postgres is filled up. Generally if memory is available it is good to be utilized, however since a database engine doesn't know what else is on the system, we have that limit, otherwise it might just use up everything for caching.
Hello! It looks like you're interested in this conversation, but you don't have an account yet.
Getting fed up of having to scroll through the same posts each visit? When you register for an account, you'll always come back to exactly where you were before, and choose to be notified of new replies (either via email, or push notification). You'll also be able to save bookmarks and upvote posts to show your appreciation to other community members.
With your input, this post could be even better 💗
Register Login