Cloudron makes it easy to run web apps like WordPress, Nextcloud, GitLab on your server. Find out more or install now.


Skip to content
  • Categories
  • Recent
  • Tags
  • Popular
  • Bookmarks
  • Search
Skins
  • Light
  • Cerulean
  • Cosmo
  • Flatly
  • Journal
  • Litera
  • Lumen
  • Lux
  • Materia
  • Minty
  • Morph
  • Pulse
  • Sandstone
  • Simplex
  • Sketchy
  • Spacelab
  • United
  • Yeti
  • Zephyr
  • Dark
  • Cyborg
  • Darkly
  • Quartz
  • Slate
  • Solar
  • Superhero
  • Vapor

  • Default (No Skin)
  • No Skin
Collapse
Brand Logo

Cloudron Forum

Apps | Demo | Docs | Install
  1. Cloudron Forum
  2. Prometheus
  3. What port do Prometheus listen on, for Grafana to connect?

What port do Prometheus listen on, for Grafana to connect?

Scheduled Pinned Locked Moved Prometheus
21 Posts 3 Posters 307 Views 3 Watching
  • Oldest to Newest
  • Newest to Oldest
  • Most Votes
Reply
  • Reply as topic
Log in to reply
This topic has been deleted. Only users with topic management privileges can see it.
  • J joseph

    @stoccafisso just the https port (all apps on cloudron are behind a reverse proxy). so https://prometheus.cloudron.tld

    S Offline
    S Offline
    stoccafisso
    wrote last edited by
    #4

    @joseph I tried both with or without https://

    1 Reply Last reply
    0
    • jamesJ Offline
      jamesJ Offline
      james
      Staff
      wrote last edited by james
      #5

      Installed on the demo server, Prometheus https://pm.demo.cloudron.io and Grafana https://grafa.demo.cloudron.io

      Added Prometheus as a new data source and used basic auth.
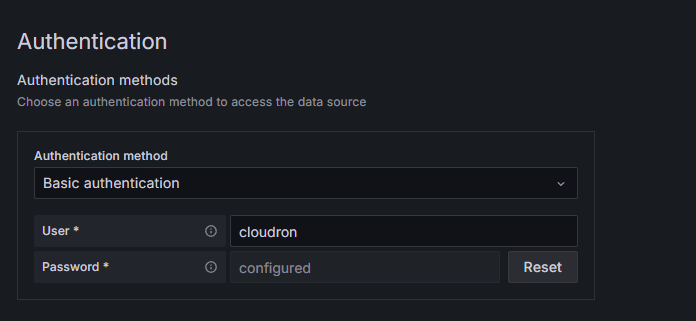
      image.png

      Save and test:
      58861462-77d0-4cb2-b45a-9e7b9129d5de-image.png

      You can check it out https://my.demo.cloudron.io/ cloudron:cloudron as the login and Grafana default admin is admin:admin.

      S 1 Reply Last reply
      2
      • jamesJ james

        Installed on the demo server, Prometheus https://pm.demo.cloudron.io and Grafana https://grafa.demo.cloudron.io

        Added Prometheus as a new data source and used basic auth.

        image.png

        Save and test:
        58861462-77d0-4cb2-b45a-9e7b9129d5de-image.png

        You can check it out https://my.demo.cloudron.io/ cloudron:cloudron as the login and Grafana default admin is admin:admin.

        S Offline
        S Offline
        stoccafisso
        wrote last edited by
        #6

        Hi @james

        Now I see, it was just to skip the port 9090 behind URL. I didn't even consider it possible. Thank you, it worked now 🙂

        jamesJ 1 Reply Last reply
        1
        • S stoccafisso

          Hi @james

          Now I see, it was just to skip the port 9090 behind URL. I didn't even consider it possible. Thank you, it worked now 🙂

          jamesJ Offline
          jamesJ Offline
          james
          Staff
          wrote last edited by
          #7

          @stoccafisso Happy to help.

          1 Reply Last reply
          2
          • S Offline
            S Offline
            stoccafisso
            wrote last edited by
            #8

            But now I experience another problem. Grafana doesnt seem to condsider the new modified prometheus config file. Is there some cache stored in Grafana, or Prometheus, that I need to clear out in order for those two to see the new config file?

            1 Reply Last reply
            0
            • S Offline
              S Offline
              stoccafisso
              wrote last edited by
              #9

              Ahh...in Prometheus, just click "Status - Service discovery"

              1 Reply Last reply
              1
              • S Offline
                S Offline
                stoccafisso
                wrote last edited by
                #10

                You may set it to "solved" 👍

                1 Reply Last reply
                0
                • S Offline
                  S Offline
                  stoccafisso
                  wrote last edited by stoccafisso
                  #11

                  Hmm....Grafana seems not to pick up on the new sources. And I cant find any refresh/reload button in Grafana. Any advice?

                  jamesJ 1 Reply Last reply
                  0
                  • S stoccafisso

                    Hmm....Grafana seems not to pick up on the new sources. And I cant find any refresh/reload button in Grafana. Any advice?

                    jamesJ Offline
                    jamesJ Offline
                    james
                    Staff
                    wrote last edited by
                    #12

                    @stoccafisso when changing config files inside an app, it is always a good idea to restart the app.
                    Did you do that?

                    1 Reply Last reply
                    1
                    • S Offline
                      S Offline
                      stoccafisso
                      wrote last edited by
                      #13

                      Yes, restarted both after updating "Status - Service discovery" in Prometheus. Even deleted the "prometheus" in Grafana and loaded a new one. It did not pick up on the new services in Prometheus

                      1 Reply Last reply
                      0
                      • S Offline
                        S Offline
                        stoccafisso
                        wrote last edited by
                        #14

                        screenshot-prometheus.dnfi.no-2025.05.26-17_25_10.png

                        As you see, I have two new endpoints recogniced by Prometheus, but Grafana will not pick up that information

                        1 Reply Last reply
                        0
                        • S Offline
                          S Offline
                          stoccafisso
                          wrote last edited by
                          #15

                          screenshot-grafana.dnfi.no-2025.05.26-17_29_23.png

                          1 Reply Last reply
                          0
                          • jamesJ Offline
                            jamesJ Offline
                            james
                            Staff
                            wrote last edited by
                            #16

                            Can you push the metrics to the demo instance as well so I can take a look?

                            S 1 Reply Last reply
                            1
                            • jamesJ Offline
                              jamesJ Offline
                              james
                              Staff
                              wrote last edited by
                              #17

                              Also, inside Grafana, for the Prometheus Data source.
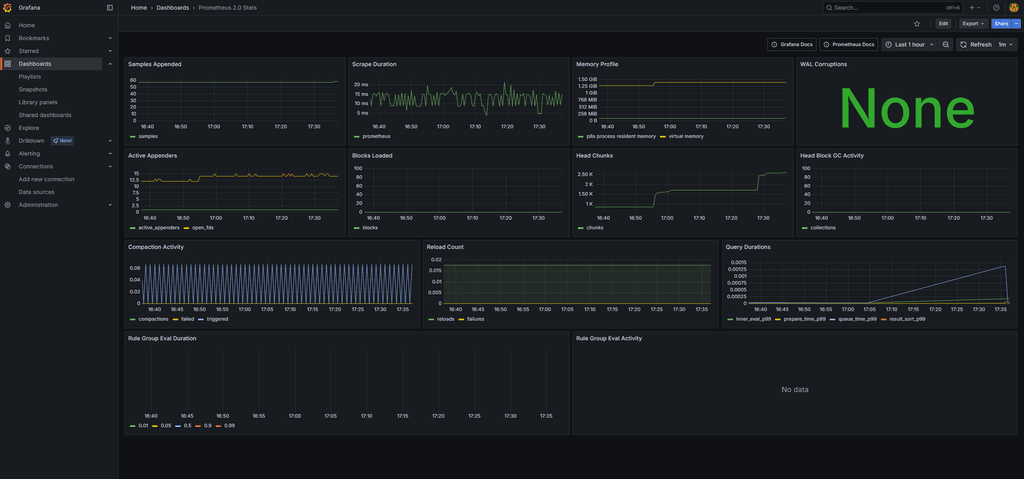
                              There is a pre-made dashboard for Prometheus:

                              image.png
                              Import it, and please view it so see, if you get any data at all.

                              0efe1553-de04-4409-980d-a7b8fc6c6917-image.png

                              1 Reply Last reply
                              2
                              • S Offline
                                S Offline
                                stoccafisso
                                wrote last edited by stoccafisso
                                #18

                                I did a brutal problemsolving hack, deleted Grafana and reinstalled it. Now it works.

                                I think it may have been the "Node Exporter Full" dashboard that was holding the old config in cache, I may have solved it just by deleting the Node Exporter Full and then reinstalled it.

                                1 Reply Last reply
                                1
                                • jamesJ james

                                  Can you push the metrics to the demo instance as well so I can take a look?

                                  S Offline
                                  S Offline
                                  stoccafisso
                                  wrote last edited by
                                  #19

                                  @james How do I do that? And is it needed? I have solved the problem?

                                  jamesJ 1 Reply Last reply
                                  0
                                  • S stoccafisso

                                    @james How do I do that? And is it needed? I have solved the problem?

                                    jamesJ Offline
                                    jamesJ Offline
                                    james
                                    Staff
                                    wrote last edited by
                                    #20

                                    @stoccafisso no, that is no longer needed since you have solved your issue.

                                    S 1 Reply Last reply
                                    2
                                    • jamesJ james

                                      @stoccafisso no, that is no longer needed since you have solved your issue.

                                      S Offline
                                      S Offline
                                      stoccafisso
                                      wrote last edited by
                                      #21

                                      @james and @joseph Thanks for helping 👍

                                      1 Reply Last reply
                                      1
                                      Reply
                                      • Reply as topic
                                      Log in to reply
                                      • Oldest to Newest
                                      • Newest to Oldest
                                      • Most Votes


                                      • Login

                                      • Don't have an account? Register

                                      • Login or register to search.
                                      • First post
                                        Last post
                                      0
                                      • Categories
                                      • Recent
                                      • Tags
                                      • Popular
                                      • Bookmarks
                                      • Search