Cloudron makes it easy to run web apps like WordPress, Nextcloud, GitLab on your server. Find out more or install now.


Skip to content

Prometheus

15 Topics 146 Posts
  • Prometheus - Package Updates

    Pinned
    84
    1 Votes
    84 Posts
    2k Views
    girishG

    [1.9.0]

    Update alertmanager to 0.27.0 Full changelog [CHANGE] Discord Integration: Enforce max length in message. #3597 [CHANGE] API: Removal of all api/v1/ endpoints. These endpoints now log and return a deprecation message and respond with a status code of 410. #2970 [FEATURE] UTF-8 Support: Introduction of support for any UTF-8 character as part of label names and matchers. Please read more below. #3453, #3483, #3567, #3570 [FEATURE] Metrics: Introduced the experimental feature flag --enable-feature=receiver-name-in-metrics to include the receiver name in the following metrics: #3045 [FEATURE] Metrics: Introduced a new gauge named alertmanager_inhibition_rules that counts the number of configured inhibition rules. #3681 [FEATURE] Metrics: Introduced a new counter named alertmanager_alerts_supressed_total that tracks muted alerts, it contains a reason label to indicate the source of the mute. #3565
  • 1 Votes
    2 Posts
    17 Views
    girishG

    @agitk this is the Cloudron forum . Here we discsus the Promotheus package of Cloudron . Are you using Cloudron for hosting Prometheus?

    But regardless, app questions are probably best asked in https://github.com/prometheus/prometheus/discussions (I think).

  • Adding remote targets in prometheus.yml

    5
    1 Votes
    5 Posts
    198 Views
    BrutalBirdieB

    please post your yaml with removed / redacted sensitive information in a code block and not plain.
    You can also always use

    e.g. :

    job_name: <SYSTEM-NAMEN> scrape_interval: 5s static_configs: - targets: ['<MY-IP:9100']

    yamllint is also a great to to check if you yaml file is valid.

  • 1 Votes
    5 Posts
    97 Views
    L

    @girish Hi Girish! So I could totally be misreading this, but after some testing, it really does look like CPU and Mem stats do come through from the underlying host... Here is what I tried to confirm this. Let me know if I am way off base and I'm missing something crucial.

    First, just base observations:

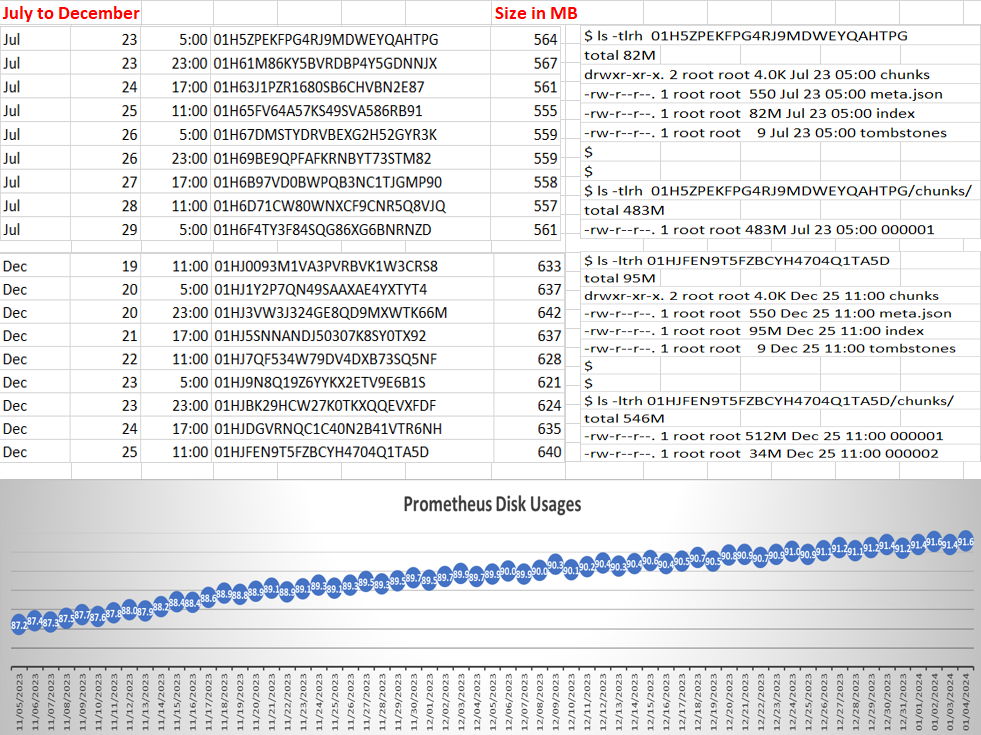
    Prometheus reports back 4GB of total system memory, much more than the 512MB I have allocated for the Prometheus app container itself. Most of the time, the CPU utilization of my host VPS hovers around 2-3% as reported by Prometheus data, whereas the (according to Top) CPU utilization of the container is 1-2.5% Graphs on my VPS provider's control panel roughly correlate to the CPU utilization observed in Prometheus data.

    Second, based on stress-testing

    Using Stress to stress-test individual CPUs or all CPUs to 100% in the host system correctly registers corresponding observations in Prometheus data. Using Stress -vm within the Prometheus app container to take up 256MB of RAM correctly registers a ~256MB bump over existing baseline memory observations from Prometheus data, and not 50+% utilization as would be expected if the container stats were being reported (container has 512MB allocated to it). Using Stress -vm out on the host system to chew up 2 GB of memory correctly shows a ~2GB increase in memory utilization reported by Prometheus data.

    So far CPU, Mem, and Network stats are all that I have played with, and Network is the only one so far that I can confirm positively does only report the container stats instead of the host system.

    Not having correct network stats isn't a deal-breaker for me (though it would be nice, but not if doing so would put the system at risk of a container breach). I thought I'd at least report my findings thus far for anyone else that stumbles upon this.

    Anyway, even if I am wrong, I have had a real great time playing with this! Thanks for making it all possible!

  • 1 Votes
    4 Posts
    88 Views
    L

    @girish Pefect. As always, thank you for the quick response!

  • Prometheus + Grafana actually working

    Solved
    10
    1 Votes
    10 Posts
    617 Views
    girishG

    @lcd_official indeed, prometheus_variables.sh is obsolete by now. Use env.sh instead.

  • Change feature flag of prometheus

    3
    0 Votes
    3 Posts
    162 Views
    girishG

    I have adjusted the latest package to make CLI args customizable (since there's no way to do this via env vars).

  • Basic auth for incoming requests

    2
    0 Votes
    2 Posts
    71 Views
    girishG

    @JLX89 prometheus app already supports proxyAuth . Can you check with a new installation ? We even have basic auth turned on.

  • Cloudron System Backup Blocked By Prometheus

    Solved
    13
    0 Votes
    13 Posts
    617 Views
    girishG

    @Jan-Macenka yeah, there's some bug in the fs module we use . We are replacing it next release, so maybe this bug goes away.

  • Track installed apps

    2
    2 Votes
    2 Posts
    91 Views
    Jan MacenkaJ

    Blocking /metrics and /health endpoints for Apps by default

    I'd also like to track Jellyfin which I love to run as an cloudron App. It comes with pre installed Prometheus endpoint according to the documentation which I'd like to use. The default Cloudron-location for this file is /app/data/jellyfin/config/system.xml
    However I dont want to expose this endpoint to the public Internet. Any Ideas how I could prevent this?

    If we find a good solution, I think it would be best to have the /metrics and /health endpoints blocked by default because Cloudron-Admins most likely dont want to expose these to the Internet anyway.

    @girish would you have an Idea where I could apply such a config change?

    Best regards and thanks for the answer in advance 🙂

    PS: Will gladly contribute to the Documentation as we found a good solution. I just fell down the rabbit hole to a certain degree in advancing my home-lab more towards a real data-center 🙂

  • Prometheus - Cannot login

    Solved
    3
    0 Votes
    3 Posts
    119 Views
    vishnumadhusoodananV

    Thanks @girish and sorry for the late reply

  • Adding local targets to Prometheus

    2
    0 Votes
    2 Posts
    138 Views
    girishG

    @cortex said in Adding local targets to Prometheus:

    How do I add the other Cloudron apps to the targets to monitor them?

    I don't have much idea here, maybe @eriktad or @BrutalBirdie knows. In general, what is needed to add a target to Prometheus? IP Address?

  • Add option for users to add starting parameters

    Solved
    5
    0 Votes
    5 Posts
    375 Views
    nebulonN

    @brutalbirdie thanks, I merged it and made a new package release.

  • Configure prometheus.yml file

    Solved
    3
    0 Votes
    3 Posts
    423 Views
    K

    @fbartels it works, thanks!

  • 0 Votes
    3 Posts
    296 Views
    girishG

    @christophermag This should be fixed now.