OpenObserve on Cloudron - Lightweight, petabyte-scale observability
-
- Main Page: https://openobserve.ai
- Git: https://github.com/openobserve/openobserve
- Licence: AGPL-3.0
- Docker: Yes
Demo
Summary: OpenObserve (O2 for short) is a cloud-native observability platform built specifically for logs, metrics, traces, analytics, RUM (Real User Monitoring - Performance, Errors, Session Replay) designed to work at petabyte scale.
Notes: Looks like a nice, lightweight logging solution built in rust.
I was able to get a working package going pretty easily (subject to more testing).
OpenObserve serves as a seamless replacement for Elasticsearch for users who ingest data using APIs and perform searches. OpenObserve comes with its own user interface, eliminating the need for separate installation.
You can reduce your log storage costs by ~140x compared to Elasticsearch by using OpenObserve. Below, we present the results from pushing logs from our production Kubernetes cluster to both Elasticsearch and OpenObserve using Fluent Bit.

 Introduction Video
 Features:
- Logs, Metrics, Traces: Comprehensive support for various data types.
- OpenTelemetry Support: Full compatibility with OTLP for logs, metrics, and traces.
- Real User Monitoring (RUM): Includes performance tracking, error logging, and session replay.
- Dashboards, Reports, Alerts: Features over 18 different chart types for comprehensive data visualization for on-the-fly analysis and reporting along with alerting.
- Pipelines: Enrich, redact, reduce, normalize data on the fly. Stream processing for logs to metrics and more.
- Advanced Embedded GUI: Intuitive and user-friendly interface.
- SQL and PromQL Support: Query logs and traces with SQL, and metrics with SQL and PromQL.
- Single Binary or HA Installation: Install using a single binary for small deployments or in HA mode for large deployments.
- Versatile Storage Options: Supports local disk, S3, MinIO, GCS, Azure Blob Storage.
- High Availability and Clustering: Ensures reliable and scalable performance.
- Dynamic Schema: Adapts to your data structure seamlessly.
- Built-in Authentication: Secure and ready to use.
- Ease of Operation: Designed for simplicity and efficiency.
- Seamless Upgrades: Hassle-free updates.
- Multilingual UI: Supports 11 languages, including English, Spanish, German, French, Chinese, and more.
For a full list of features, check the documentation.
 Screenshots
Home

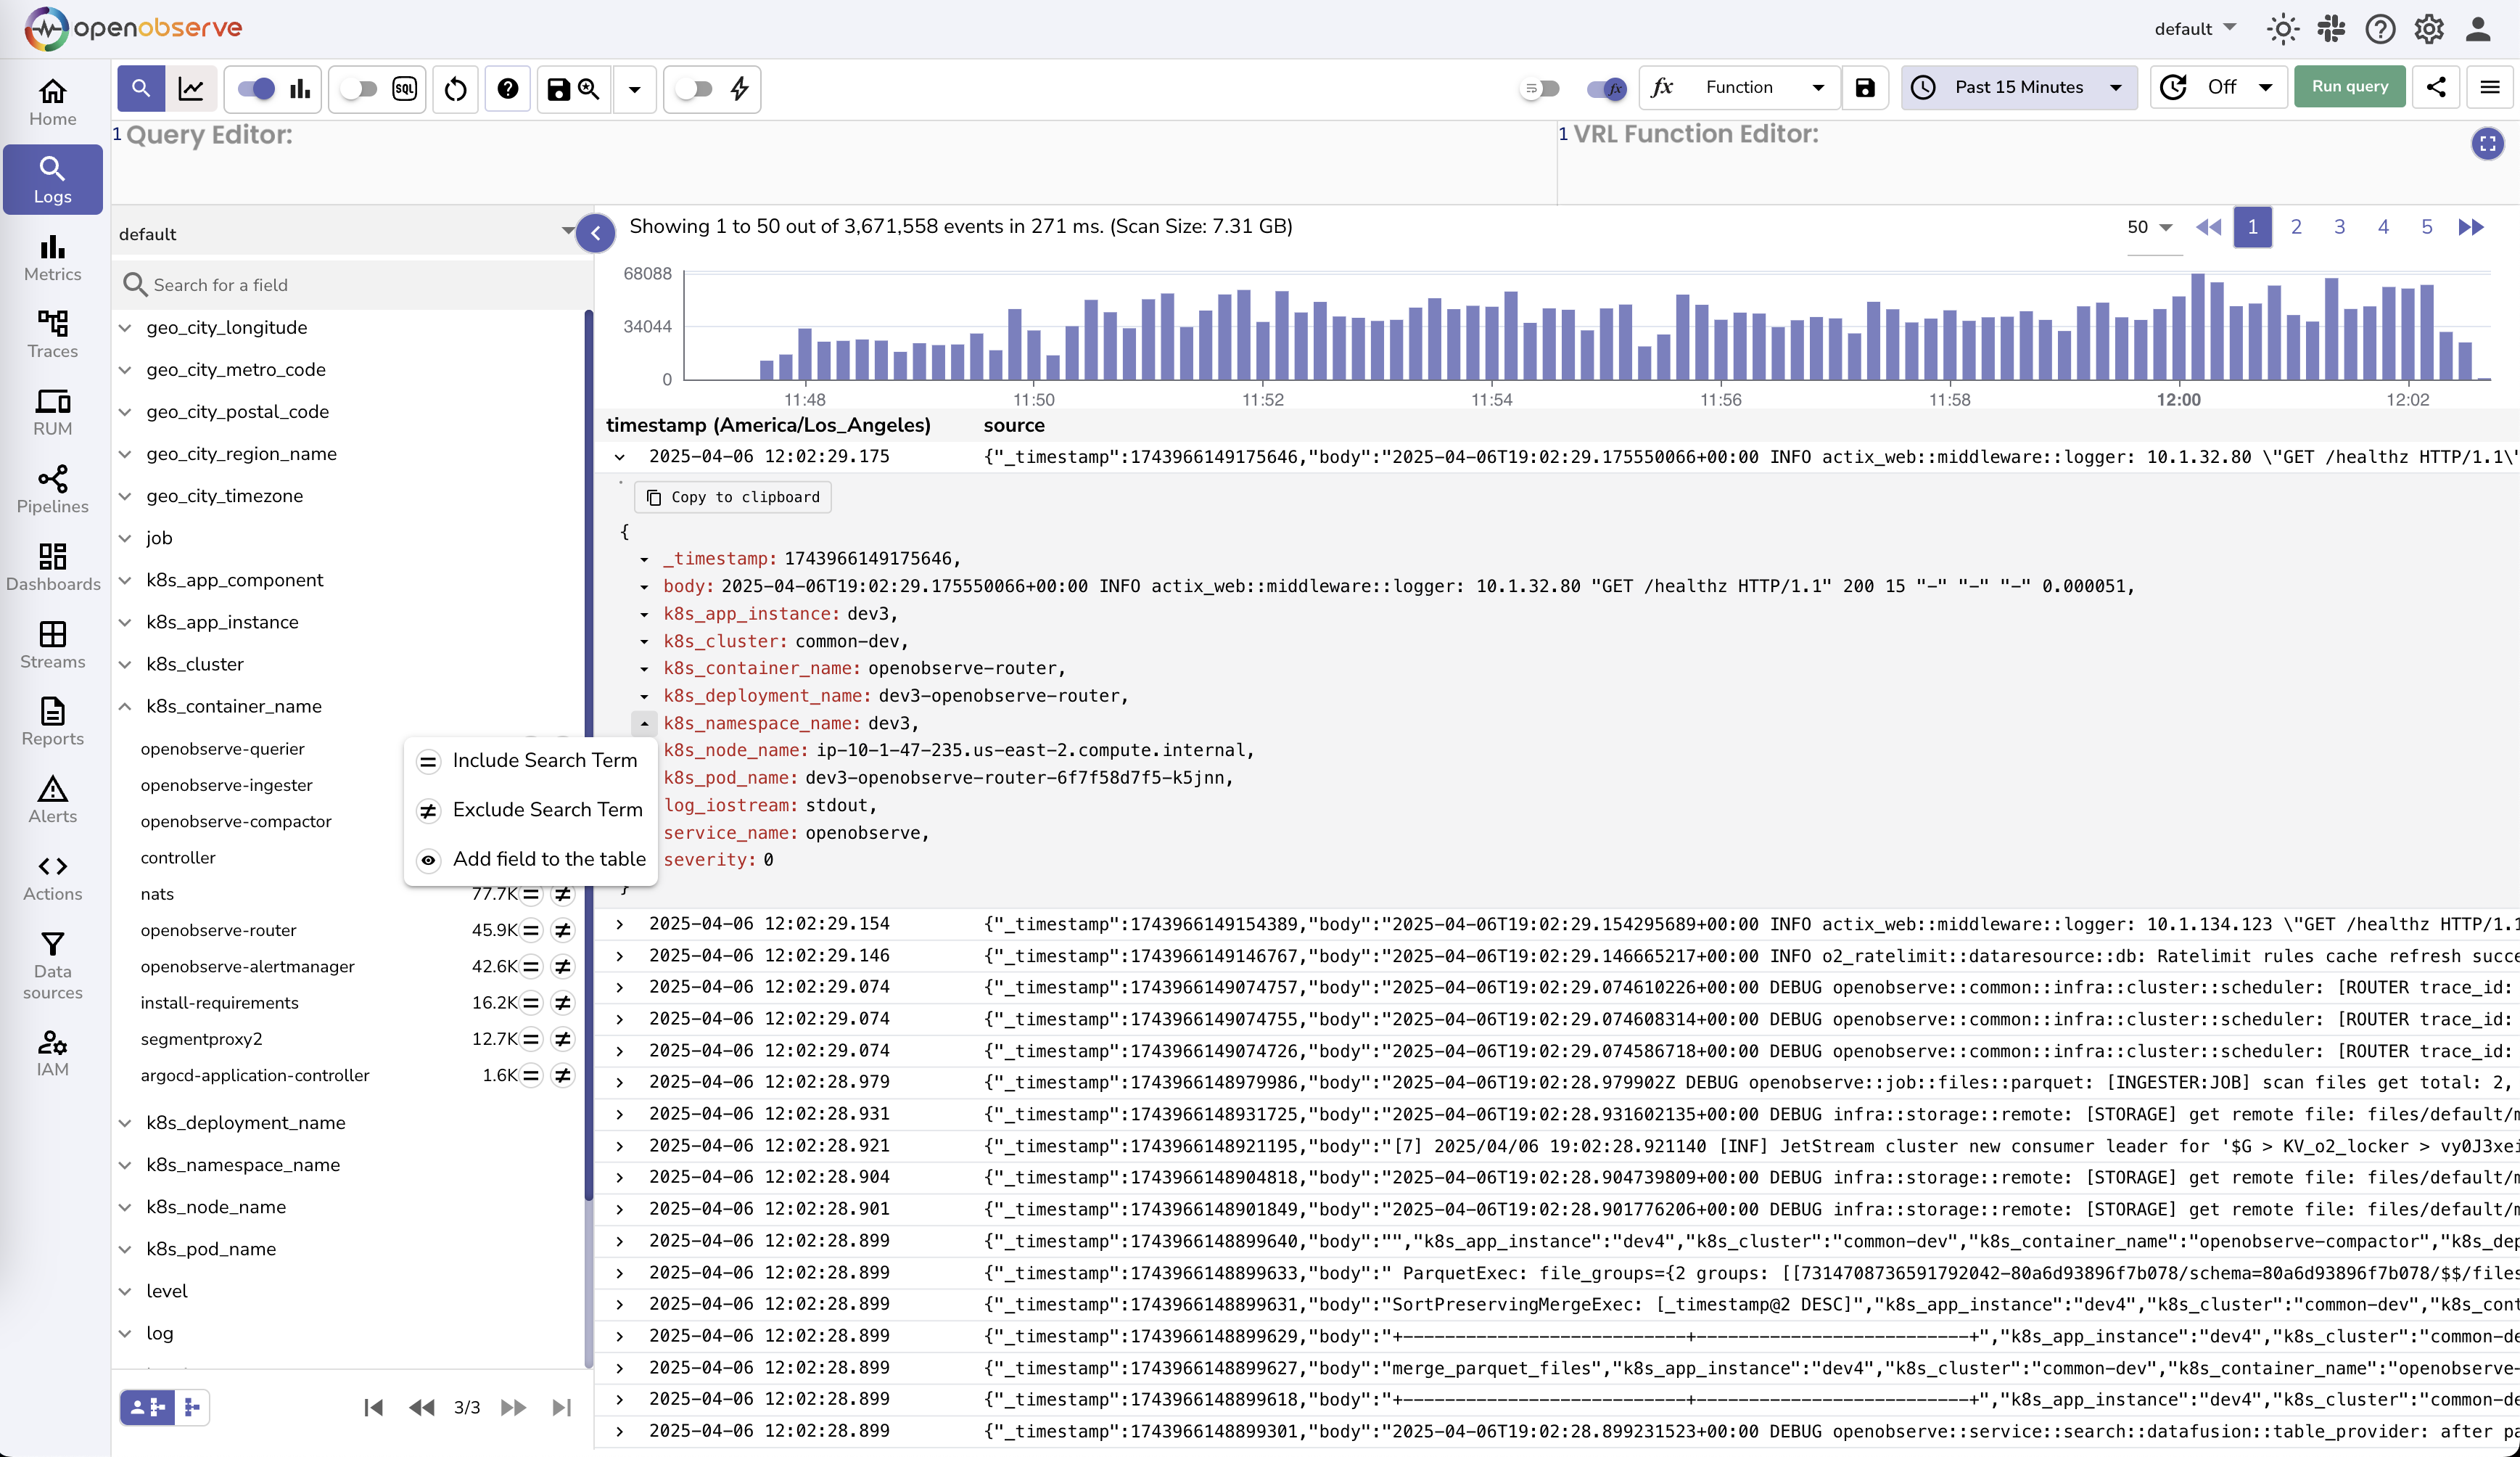
Logs
Traces (OpenTelemetry)
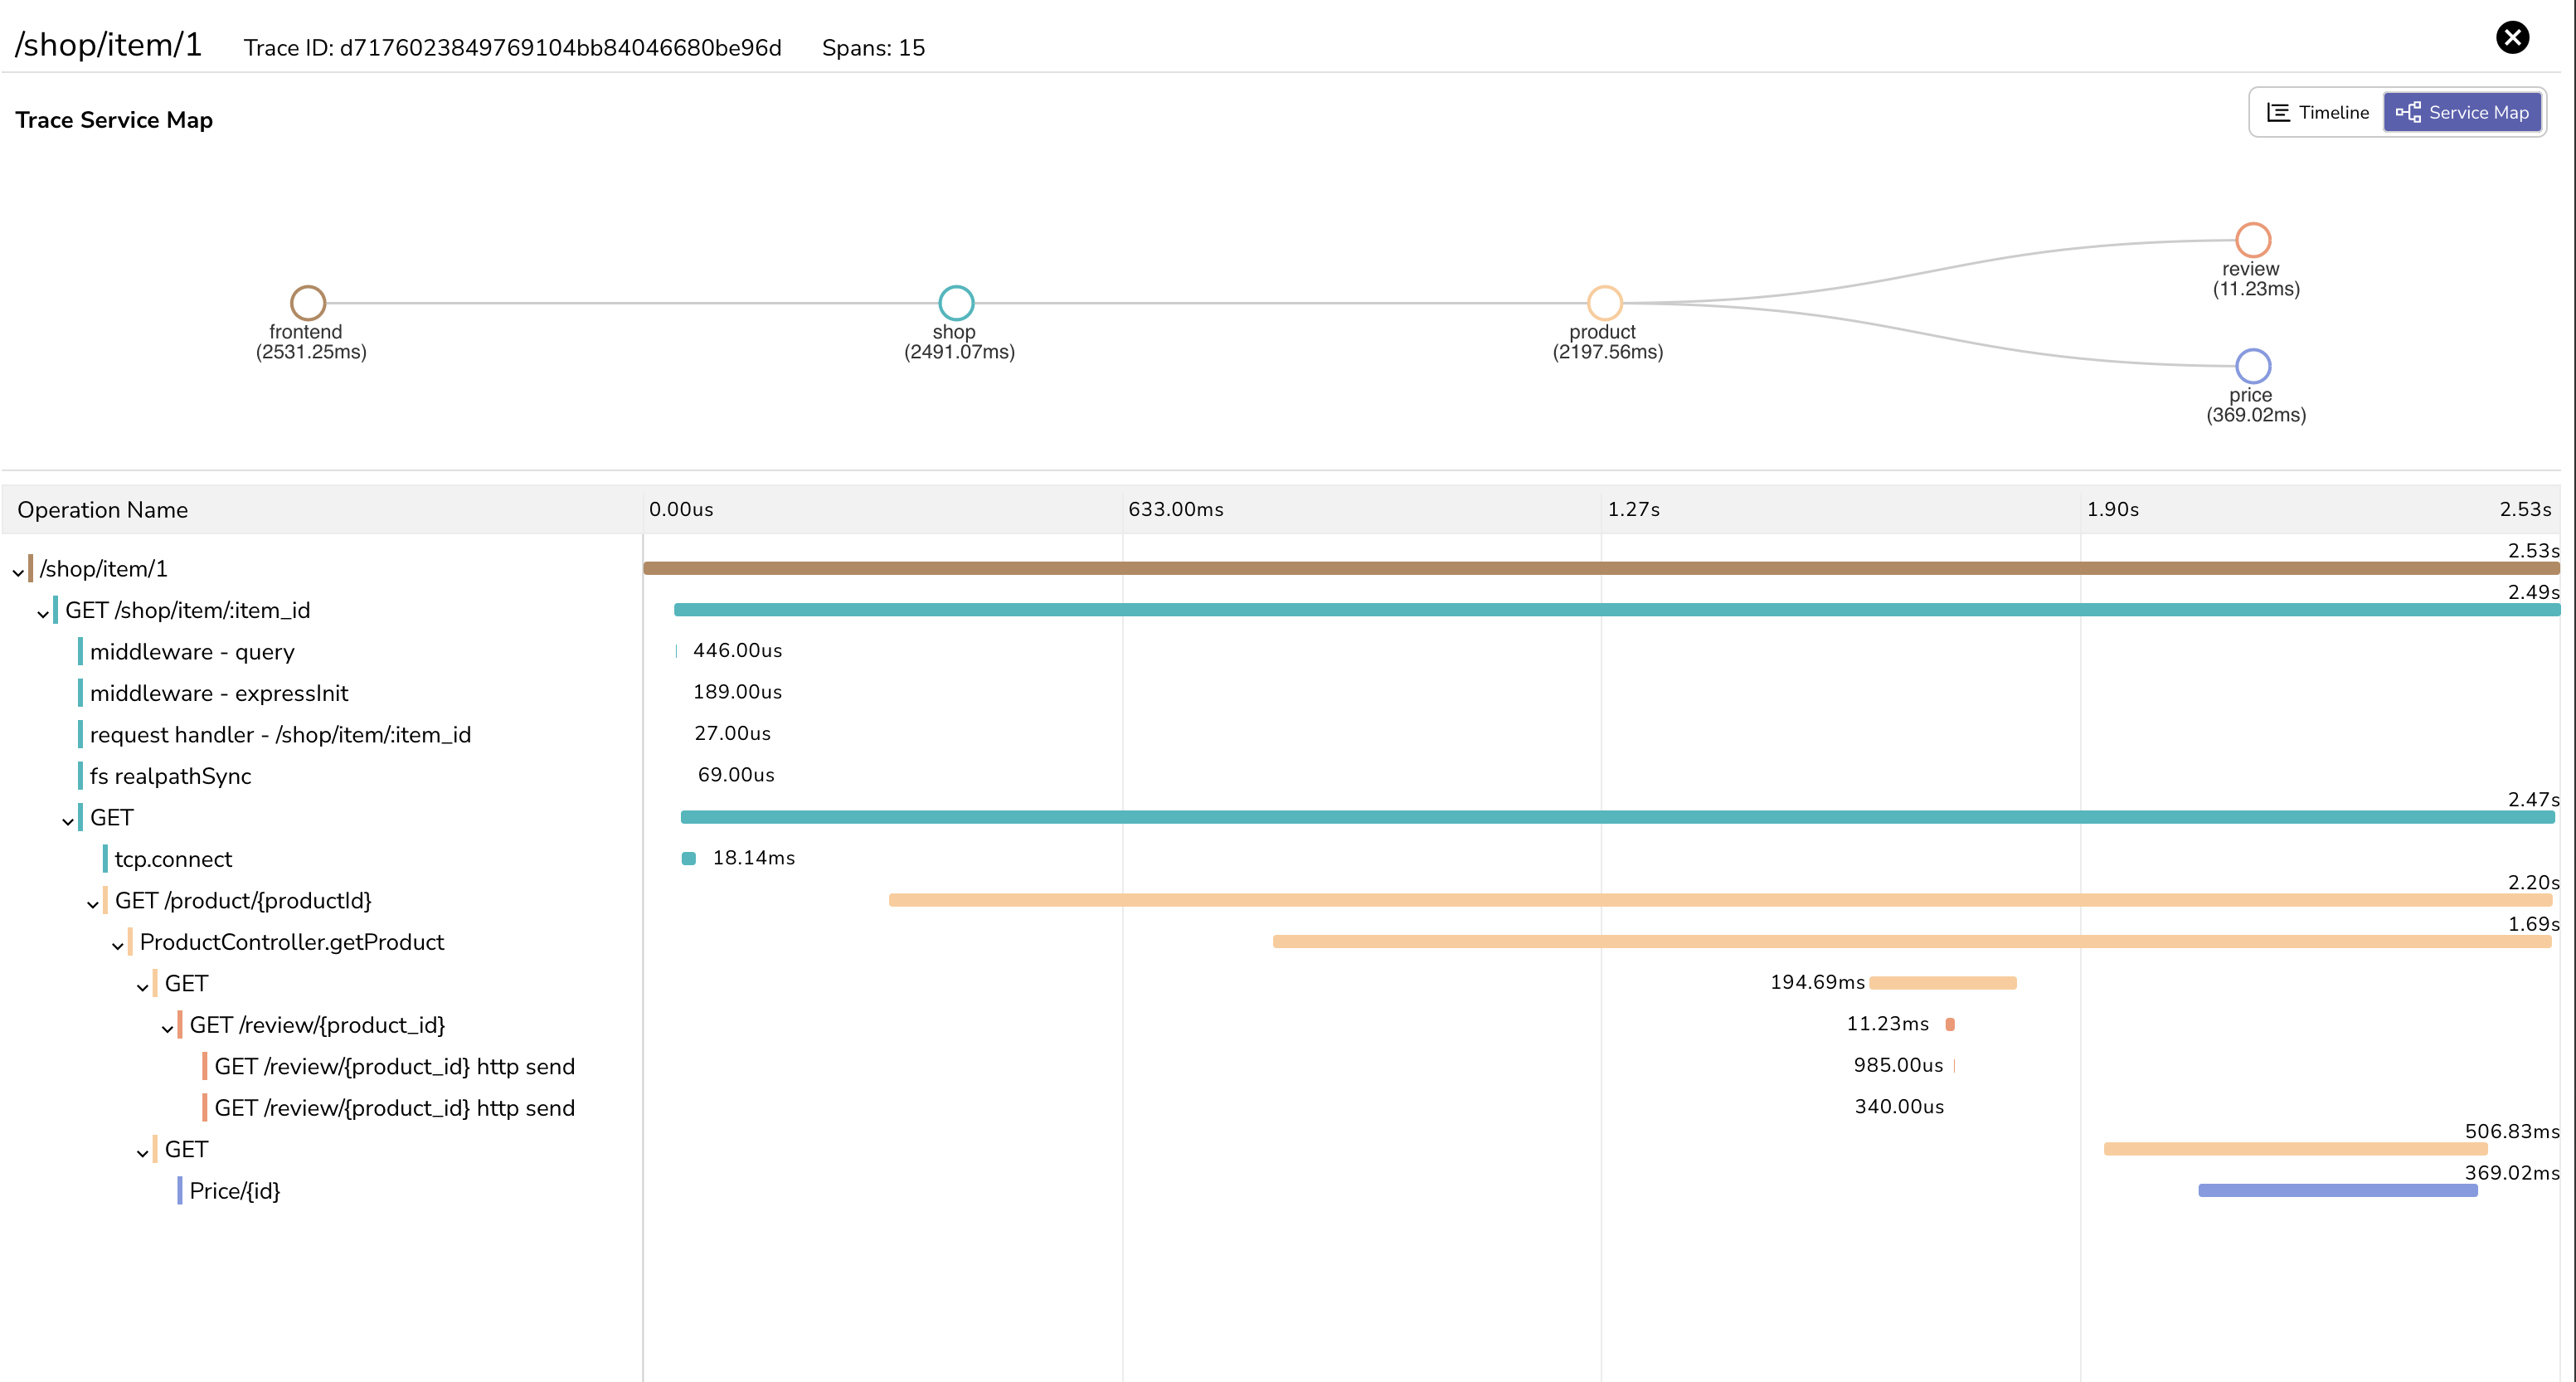
Trace details page
Golden metrics based on traces

Visualizations and Dashboards


Front end monitoring
Performance analytics

Session replay

Error tracking

Alerts

Streams

Ingestion

Pipeline
Pipeline

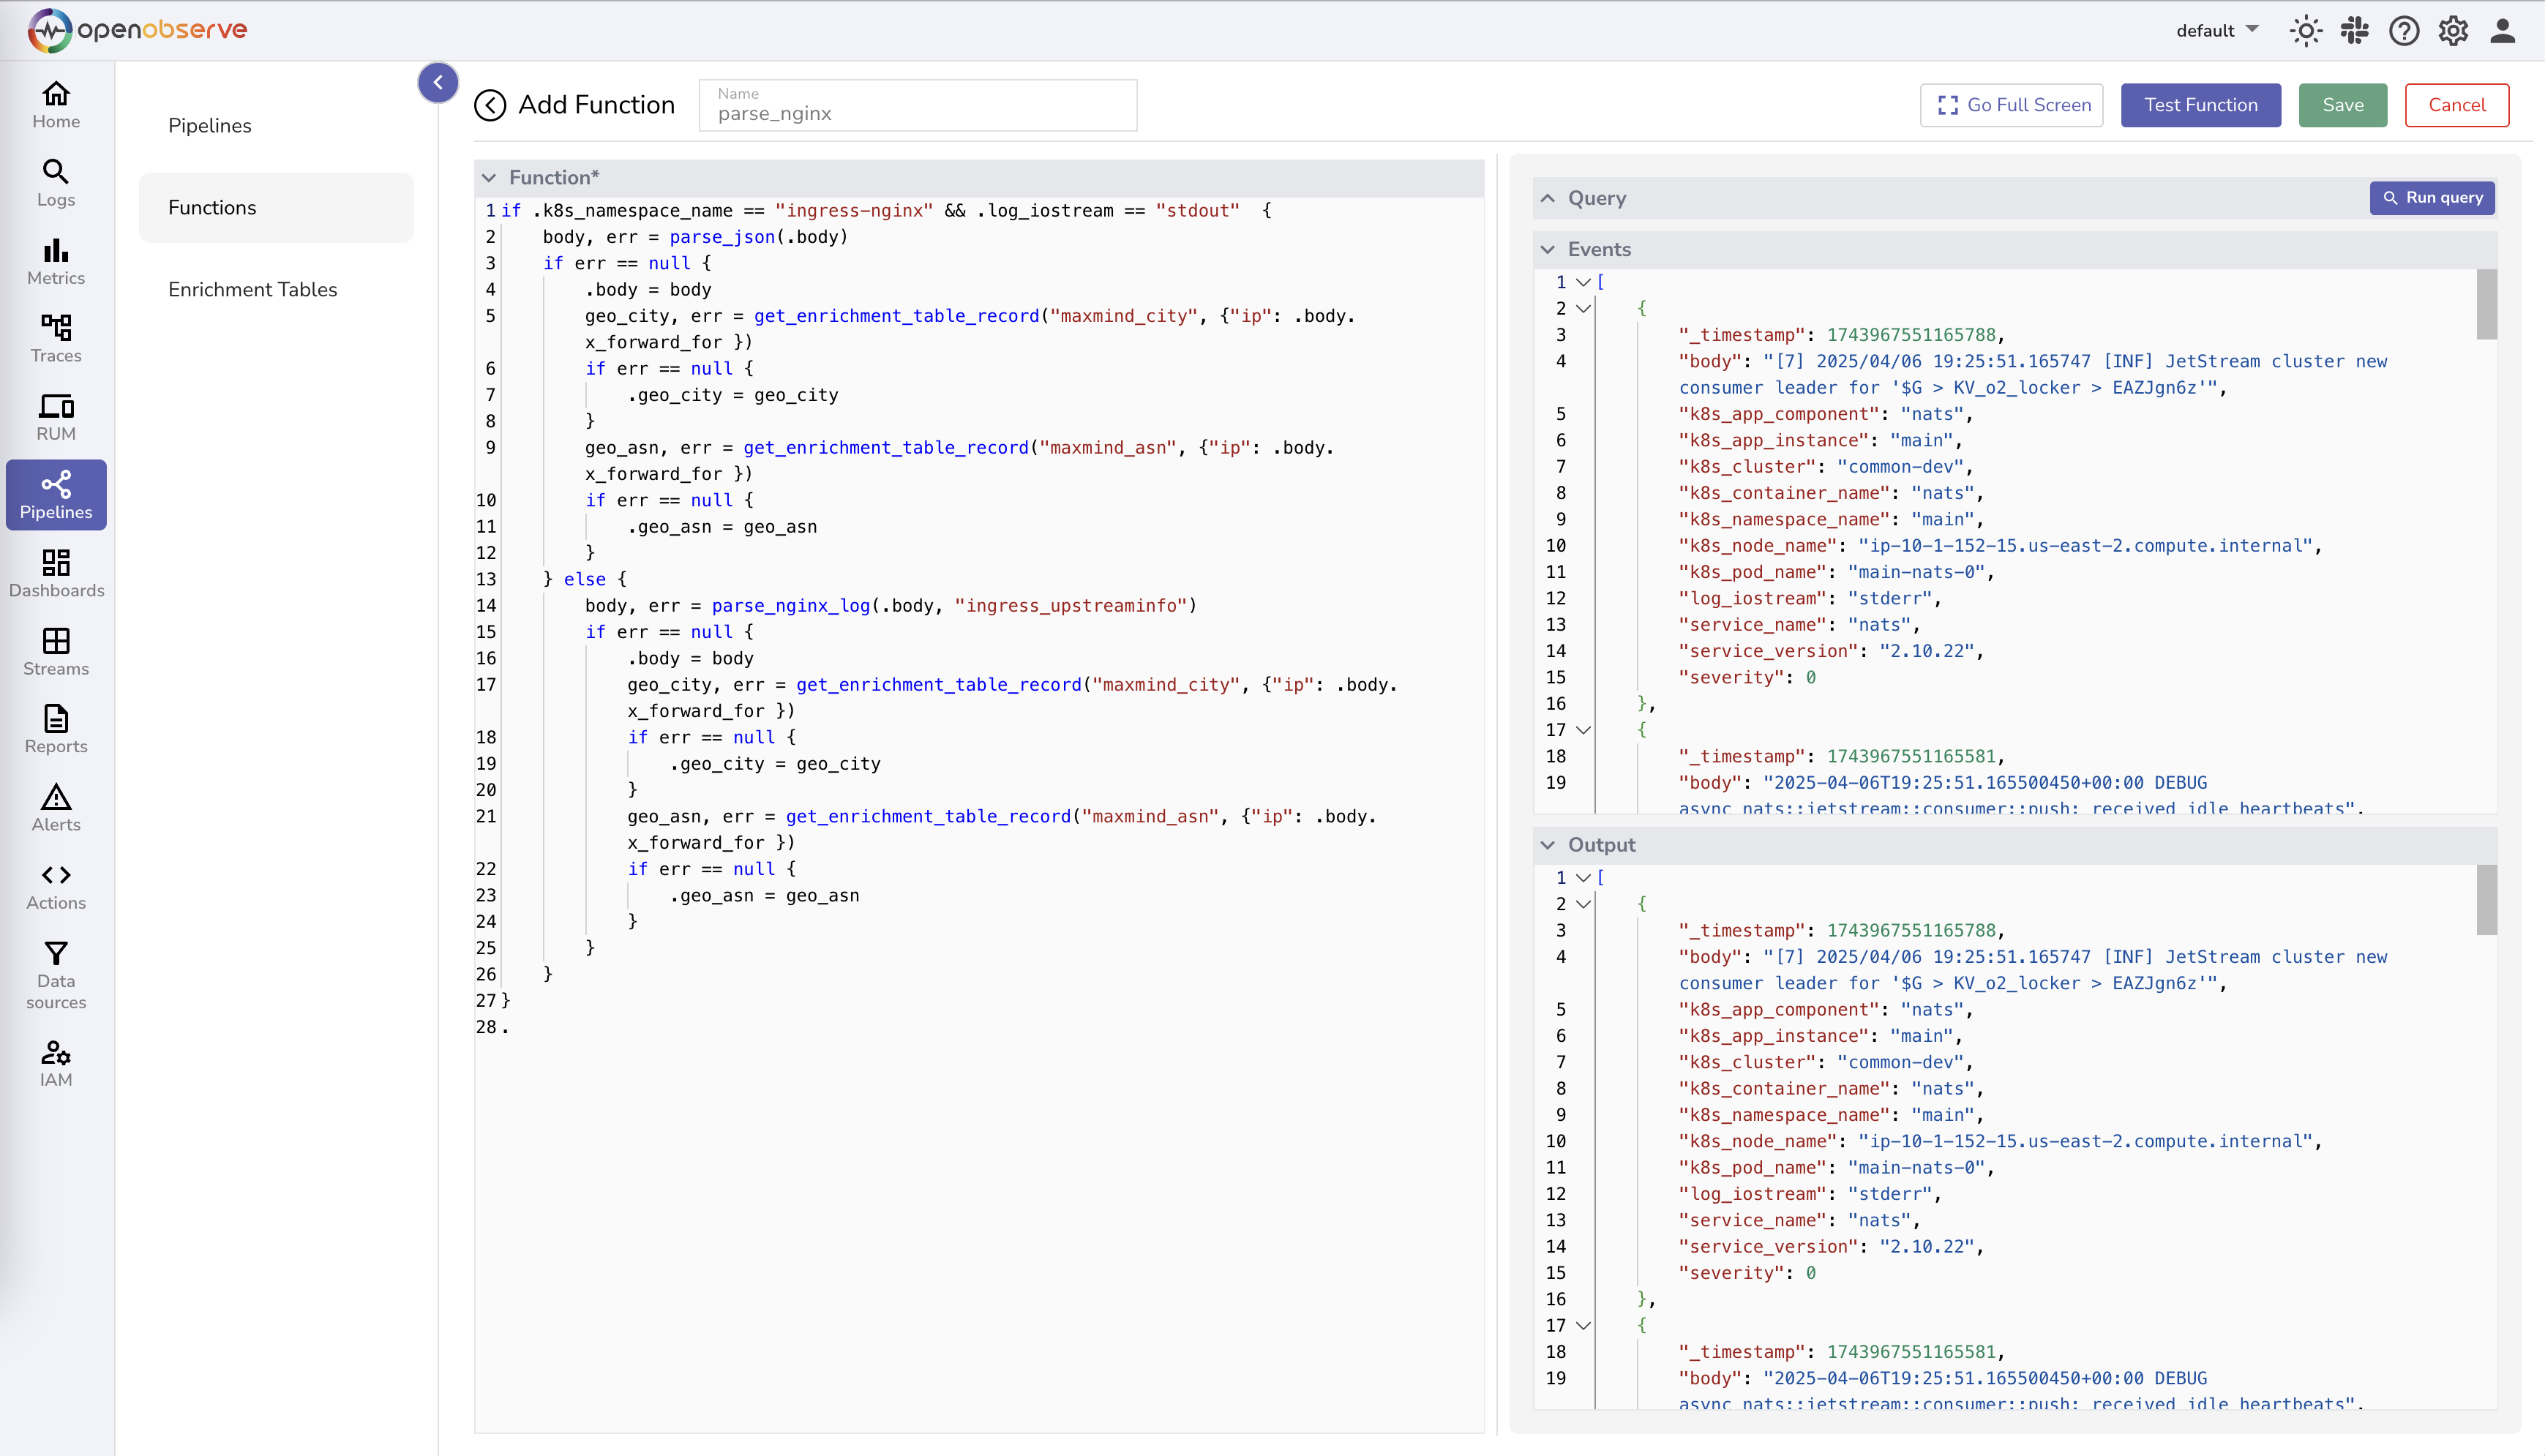
Function
IAM
SSO (Single Sign On)

RBAC (Role Based Access Control)

-
- Main Page: https://openobserve.ai
- Git: https://github.com/openobserve/openobserve
- Licence: AGPL-3.0
- Docker: Yes
Demo
Summary: OpenObserve (O2 for short) is a cloud-native observability platform built specifically for logs, metrics, traces, analytics, RUM (Real User Monitoring - Performance, Errors, Session Replay) designed to work at petabyte scale.
Notes: Looks like a nice, lightweight logging solution built in rust.
I was able to get a working package going pretty easily (subject to more testing).
OpenObserve serves as a seamless replacement for Elasticsearch for users who ingest data using APIs and perform searches. OpenObserve comes with its own user interface, eliminating the need for separate installation.
You can reduce your log storage costs by ~140x compared to Elasticsearch by using OpenObserve. Below, we present the results from pushing logs from our production Kubernetes cluster to both Elasticsearch and OpenObserve using Fluent Bit.
Introduction Video Features:- Logs, Metrics, Traces: Comprehensive support for various data types.
- OpenTelemetry Support: Full compatibility with OTLP for logs, metrics, and traces.
- Real User Monitoring (RUM): Includes performance tracking, error logging, and session replay.
- Dashboards, Reports, Alerts: Features over 18 different chart types for comprehensive data visualization for on-the-fly analysis and reporting along with alerting.
- Pipelines: Enrich, redact, reduce, normalize data on the fly. Stream processing for logs to metrics and more.
- Advanced Embedded GUI: Intuitive and user-friendly interface.
- SQL and PromQL Support: Query logs and traces with SQL, and metrics with SQL and PromQL.
- Single Binary or HA Installation: Install using a single binary for small deployments or in HA mode for large deployments.
- Versatile Storage Options: Supports local disk, S3, MinIO, GCS, Azure Blob Storage.
- High Availability and Clustering: Ensures reliable and scalable performance.
- Dynamic Schema: Adapts to your data structure seamlessly.
- Built-in Authentication: Secure and ready to use.
- Ease of Operation: Designed for simplicity and efficiency.
- Seamless Upgrades: Hassle-free updates.
- Multilingual UI: Supports 11 languages, including English, Spanish, German, French, Chinese, and more.
For a full list of features, check the documentation.
ScreenshotsHome
Logs
Traces (OpenTelemetry)
Trace details page
Golden metrics based on traces
Visualizations and Dashboards
Front end monitoring
Performance analytics
Session replay
Error tracking
Alerts
Streams
Ingestion
Pipeline
Pipeline
Function
IAM
SSO (Single Sign On)
RBAC (Role Based Access Control)
@andreasdueren Wow, that would make me feel really clever
") (goes to buy 10 more monitors for the sys admin flight deck
(goes to buy 10 more monitors for the sys admin flight deck  )
)Web Design & Development: https://www.evergreen.je
Technology & Apps: https://www.marcusquinn.com -
@andreasdueren Wow, that would make me feel really clever
(goes to buy 10 more monitors for the sys admin flight deck )@marcusquinn haha
-
@marcusquinn I would build a new room with floor to ceiling monitors on one wall. Reclining theatre seating and a kegerator. And a Hirsh keypad to prevent anyone except me from entering:)
@crazybrad Ahah, the stuff of movies

-
I use and like
Seqbut it can't be packaged for Cloudron, so OpenObserve might be an interesting replacement.@andreasdueren do you have a built docker image accessible in a docker registry ?
If so, I can add to my custom app installer.I'd be interested to try this out.
Indie app dev, huge fan of Cloudron PaaS, scratching my itches : communityapps.appx.uk
-
I use and like
Seqbut it can't be packaged for Cloudron, so OpenObserve might be an interesting replacement.@andreasdueren do you have a built docker image accessible in a docker registry ?
If so, I can add to my custom app installer.I'd be interested to try this out.
@timconsidine yes: andreasdueren/openobserve-cloudron:0.1.3
-
@timconsidine yes: andreasdueren/openobserve-cloudron:0.1.3
@andreasdueren thank you

Added to custom app installer at https://ccai.appx.uk
Installed.
Need to get to know itIndie app dev, huge fan of Cloudron PaaS, scratching my itches : communityapps.appx.uk
-
@andreasdueren thank you
Added to custom app installer at https://ccai.appx.uk
Installed.
Need to get to know it@timconsidine you can also add the matrix WhatsApp bridge: andreasdueren/mautrix-whatsapp-cloudron:1.2.2
-
@timconsidine you can also add the matrix WhatsApp bridge: andreasdueren/mautrix-whatsapp-cloudron:1.2.2
@andreasdueren done
-
First impression of OpenObserve : cool !
Definitely a contender to replace my instance of Seq
But a lot to learn about the app and how I can best use it. -
I was able to get a working package going pretty easily (subject to more testing).
Is this still available ? Seems not.
I've had to remove it temporarily from my CustomAppGateway catalogue. Very happy to put it back with updated repo/dcoker image links.If you're not using OpenObserve anymore and have moved on, I might take a bashing at packaging it, because it is definitely useful and contender to replace my hosted Seq (incapable of self-hosting).
Indie app dev, huge fan of Cloudron PaaS, scratching my itches : communityapps.appx.uk
-
I was able to get a working package going pretty easily (subject to more testing).
Is this still available ? Seems not.
I've had to remove it temporarily from my CustomAppGateway catalogue. Very happy to put it back with updated repo/dcoker image links.If you're not using OpenObserve anymore and have moved on, I might take a bashing at packaging it, because it is definitely useful and contender to replace my hosted Seq (incapable of self-hosting).
@timconsidine Sorry about that, I moved from gitea to gitlab but only migrated the projects I'm actively working on. It's an interesting application but I don't have any current strict needs, the code is here for right now if you want to continue development: https://gitea.due.ren/andreas/openobserve-cloudron
Hello! It looks like you're interested in this conversation, but you don't have an account yet.
Getting fed up of having to scroll through the same posts each visit? When you register for an account, you'll always come back to exactly where you were before, and choose to be notified of new replies (either via email, or push notification). You'll also be able to save bookmarks and upvote posts to show your appreciation to other community members.
With your input, this post could be even better 💗
Register Login