I created a community app for it https://ca.cloudron.io/app/euro-office
AppDev
Private
Cloudron App Packagers
Posts
-
Euro-Office Document Server on Cloudron — sovereign European OnlyOffice fork -
a new competitorSince the packaging skill worked so nicely for the cypht app I also created a variant of the only office app, but with euro office instead.
-
Cypht - Lightweight open source webmail application written in PHP and JavaScript@necrevistonnezr ah but that explains why it rejected the password
-
Cloudron Community App Store - Publish your app@girish ah, that explains it then. Seeing I was not the only one to that made that mistake i welcome the fix to detect the bullets automatically.
-
Cloudron Community App Store - Publish your app@fbartels the changelog file is meant to be like:
[x.y.z]
- Change 1
- Change 2
So the first chars in each line are stripped (you can also use
*etc). I have deployed a fix to strip the chars if first two are not those sequences. -
Cypht - Lightweight open source webmail application written in PHP and JavaScriptAn app password for mail clients doesn’t work
Hmm.. I cannot reproduce this. For me the login works with my users password or an app password with the mail client scope.
-
Cypht - Lightweight open source webmail application written in PHP and JavaScriptI am currently testing different projects that implement the EWS protocol and came across cypht. I have created a community app to easily install it on cloudron: https://ca.cloudron.io/app/cypht
-
Cloudron Community App Store - Publish your appThere seems to be a parsing issue with the recent changes:
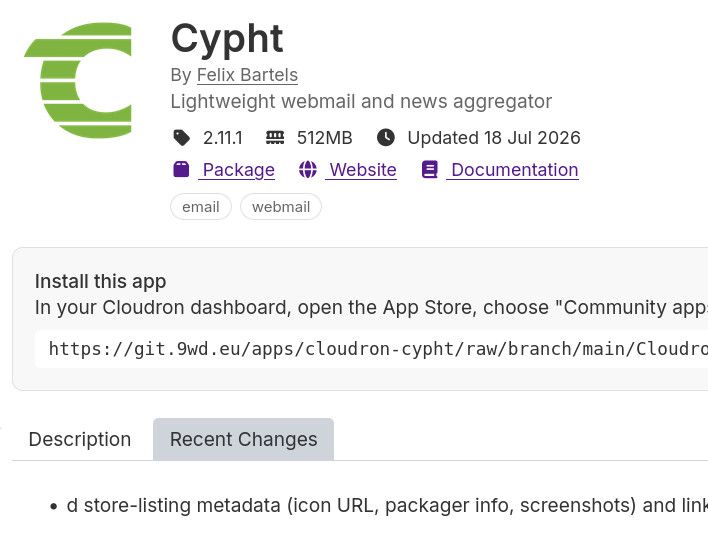
It is cutting off the first two characters it seems.
-
Cloudron Community App Store - Publish your app@timconsidine done, it's 25 now .
-
Cloudron Community App Store - Publish your appooops
You have reached the maximum number of apps.
Please sir, can I have some more ?
(after Oliver Twist)
