"The application 'MiroTalk SFU' installed at ... is not responding" because of an OOM event
-
This happened 2-3 times now on a MiroTalk SFU instance on a beefy machine with plenty of resources left, there are currently 2GB of RAM allocated to MiroTalk. It doesn't do that every week, but every other I would say. There aren't any calls going on since it happens quite early in the morning, no traffic or anything, logs don't say much (at least for me):
Sep 09 07:51:07 2025-09-09T05:51:07Z
Sep 09 07:51:07 ----- Native stack trace -----
Sep 09 07:51:07 1: 0xe36196 node::OOMErrorHandler(char const*, v8::OOMDetails const&) [node]
Sep 09 07:51:07 2: 0x123f4a0 v8::Utils::ReportOOMFailure(v8::internal::Isolate*, char const*, v8::OOMDetails const&) [node]
Sep 09 07:51:07 3: 0x123f777 v8::internal::V8::FatalProcessOutOfMemory(v8::internal::Isolate*, char const*, v8::OOMDetails const&) [node]
Sep 09 07:51:07 4: 0x146d1a5 [node]
Sep 09 07:51:07 5: 0x146d1d3 [node]
Sep 09 07:51:07 6: 0x148628a [node]
Sep 09 07:51:07 7: 0x1489458 [node]
Sep 09 07:51:07 8: 0x1cc6071 [node]
Sep 09 07:51:07 <--- JS stacktrace --->
Sep 09 07:51:07 <--- Last few GCs --->
Sep 09 07:51:07 Aborted (core dumped)
Sep 09 07:51:07 FATAL ERROR: Ineffective mark-compacts near heap limit Allocation failed - JavaScript heap out of memory
Sep 09 07:51:07 [37:0x12386000] 545929425 ms: Mark-Compact 1014.2 (1043.2) -> 1013.4 (1042.9) MB, pooled: 1 MB, 546.68 / 0.06 ms (average mu = 0.073, current mu = 0.037) task; scavenge might not succeed
Sep 09 07:51:07 [37:0x12386000] 545929953 ms: Mark-Compact 1014.2 (1042.9) -> 1013.4 (1043.2) MB, pooled: 1 MB, 502.80 / 0.00 ms (average mu = 0.062, current mu = 0.049) task; scavenge might not succeed
Sep 09 07:51:08 \npm notice
Sep 09 07:51:08 |
Sep 09 07:51:08 npm notice
Sep 09 07:51:08 npm notice Changelog: https://github.com/npm/cli/releases/tag/v11.5.2
Sep 09 07:51:08 npm notice New major version of npm available! 10.9.2 -> 11.5.2
Sep 09 07:51:08 npm notice To update run: npm install -g npm@11.5.2
Sep 09 07:52:06 => Healtheck error: Error: Timeout of 7000ms exceeded
Sep 09 07:52:06 => Healtheck error: Error: Timeout of 7000ms exceeded
Sep 09 07:52:06 => Healtheck error: Error: Timeout of 7000ms exceeded
Sep 09 07:52:06 => Healtheck error: Error: Timeout of 7000ms exceeded
Sep 09 07:52:06 => Healtheck error: Error: Timeout of 7000ms exceeded
Any idea what's going on there or what logs I could check for more info? After it dies it becomes unresponsive and 20 minutes later Cloudron sends the down notice via email, then I can react and restart it.
-
Hello @msbt
May I ask what hosting provider you are using?
Could it be that the RAM on your server is actually shared RAM and if the node your vServer is on, is in high demand your vServer might not get enough resources?
Just a thought.Is there any other process while this crash happens that is running that might take up a lot of RAM? Backups? Other apps that are running sceduled jobs at this time?
-
@james it's a Hetzner VPS (CPX51) and I admit, I'm trying to figure out the limits a bit, there are ~70 apps installed on that one, but none of those seem to be hogging a lot of RAM. Backups run at 1:00 in the morning, crash happened at ~8:00ish. I'll keep monitoring to figure out if there's a pattern, but so far I couldn't spot it.
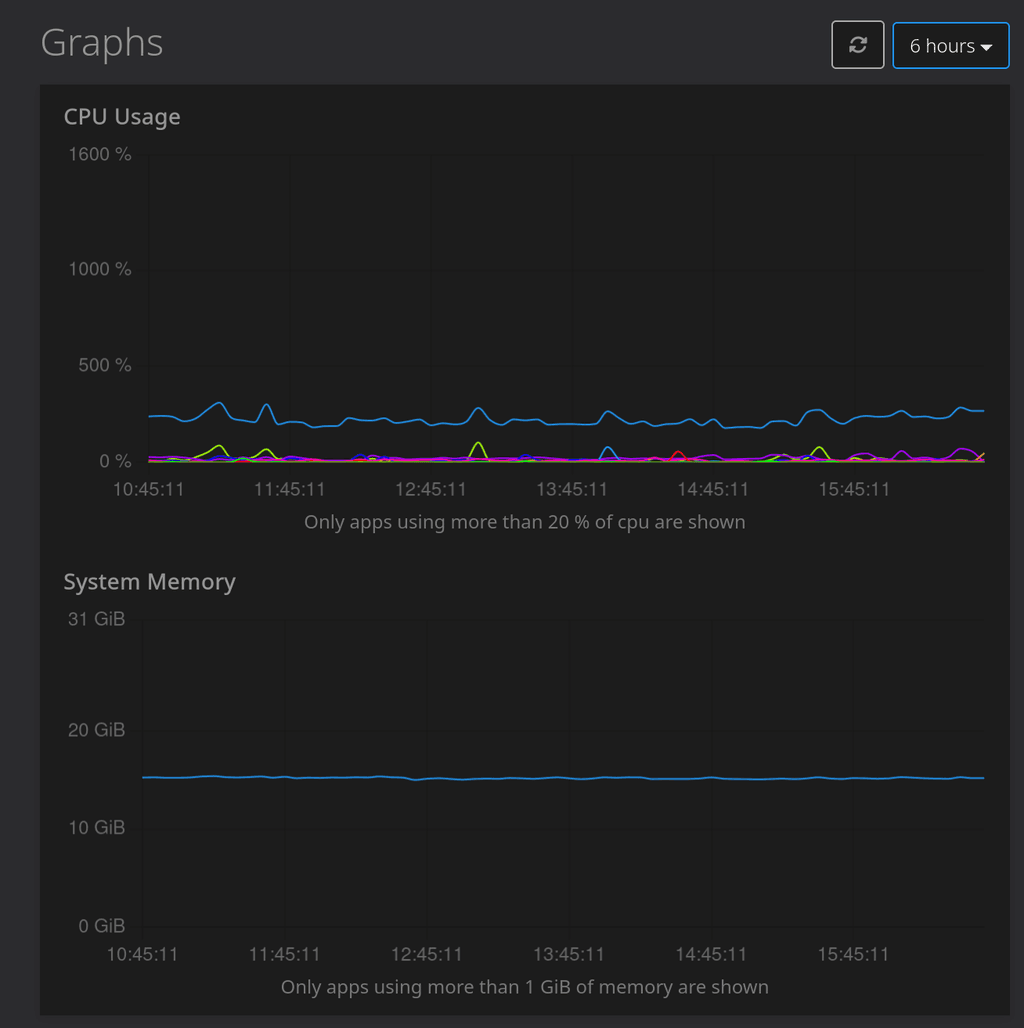
system graphs:
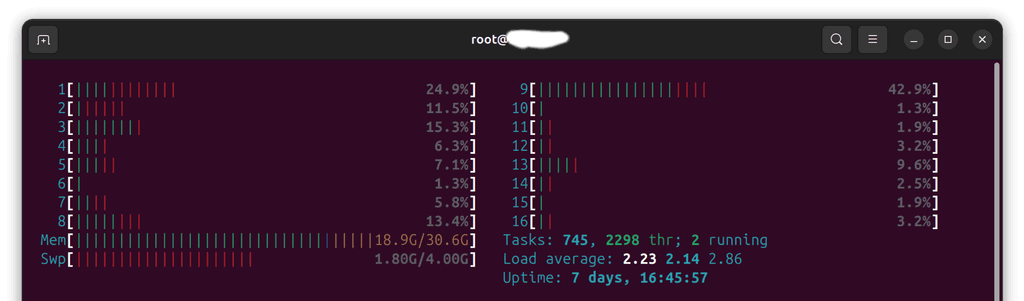
htop:
Hello! It looks like you're interested in this conversation, but you don't have an account yet.
Getting fed up of having to scroll through the same posts each visit? When you register for an account, you'll always come back to exactly where you were before, and choose to be notified of new replies (either via email, or push notification). You'll also be able to save bookmarks and upvote posts to show your appreciation to other community members.
With your input, this post could be even better 💗
Register Login