Improve CPU / resource graphs
-
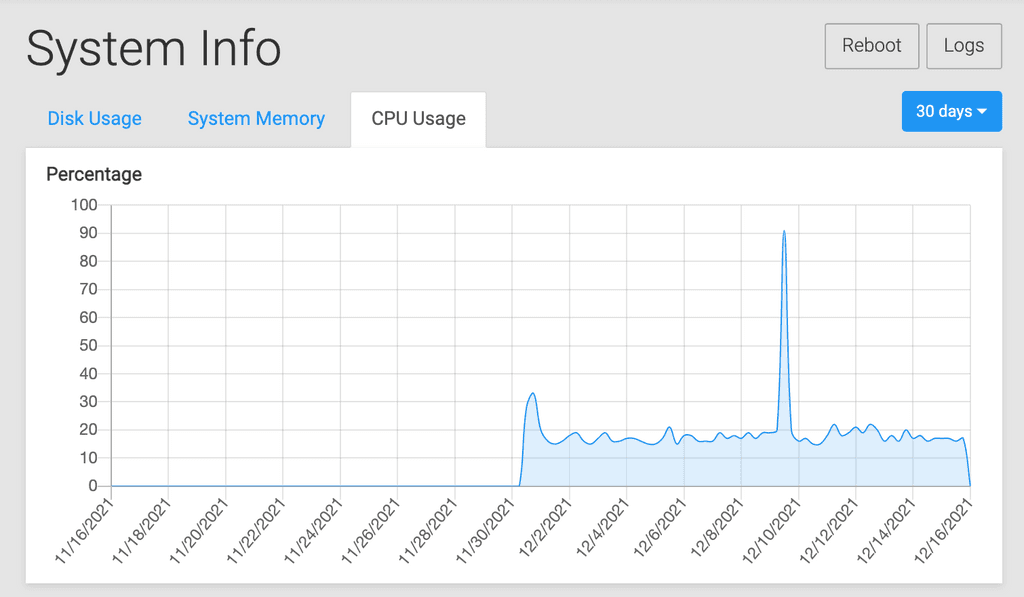
I was just going back through some history for curiosity sake in the CPU graphs... I see on December 9th I had a huge spike in CPU (for at least part of it I presume). But... there's no obivous way to look into what was consuming so much CPU time during that spike.
So I'm thinking while CPU could be consumed by something outside of Cloudron itself, it might be useful to at least add in the CPU that each app is consuming so that we can see if any particular app was consuming all that CPU. Similar to how we can already see how much memory each app uses, it'd be good to see this for CPU too. Basically this would just be a sort of 'feature-parity' for the graphs.

Related note: I totally understand and can appreciate that this detailed info would ideally be handled through some third-party dedicated server monitoring tool that's meant for those lower level details and would especially be useful for anything that's outside of Cloudron's code on the server, but I still think that having a bit more detail in the Cloudron's CPU graph would be helpful because right now it's kind of useless other than to see spikes but with no real useful information to understand what was consuming it at that time. Even if it was as simple as tagging the top 5 consuming tasks instead of all apps or something, would be at least more helpful than it currently is.

