What port do Prometheus listen on, for Grafana to connect?
-
Probably stupid question. What port do Prometheus listen on, for Grafana to connect?
I tried http://prometheus.cloudron.tld:9090 (cloudron installation) but that did not work.
-
I get this error message in Grafana:
Post "http://prometheus.cloudron.tld:9090/api/v1/query": dial tcp xxx.xxx.193.64:9090: i/o timeout - There was an error returned querying the Prometheus API.
-
@stoccafisso just the https port (all apps on cloudron are behind a reverse proxy). so https://prometheus.cloudron.tld
-
@stoccafisso just the https port (all apps on cloudron are behind a reverse proxy). so https://prometheus.cloudron.tld
@joseph I tried both with or without https://
-
Installed on the demo server, Prometheus
https://pm.demo.cloudron.ioand Grafanahttps://grafa.demo.cloudron.ioAdded Prometheus as a new data source and used basic auth.
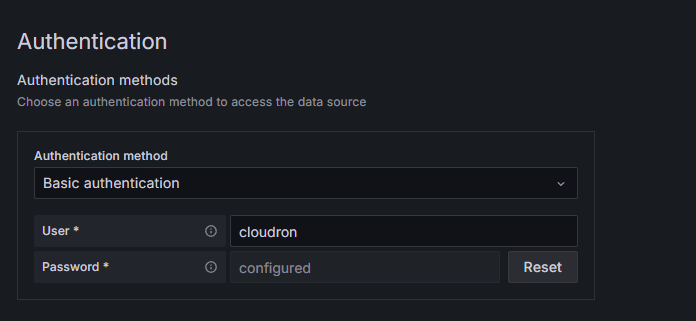
Save and test:

You can check it out https://my.demo.cloudron.io/
cloudron:cloudronas the login and Grafana default admin isadmin:admin. -
Installed on the demo server, Prometheus
https://pm.demo.cloudron.ioand Grafanahttps://grafa.demo.cloudron.ioAdded Prometheus as a new data source and used basic auth.
Save and test:
You can check it out https://my.demo.cloudron.io/
cloudron:cloudronas the login and Grafana default admin isadmin:admin. -
Hi @james
Now I see, it was just to skip the port 9090 behind URL. I didn't even consider it possible. Thank you, it worked now
")
-
But now I experience another problem. Grafana doesnt seem to condsider the new modified prometheus config file. Is there some cache stored in Grafana, or Prometheus, that I need to clear out in order for those two to see the new config file?
-
Ahh...in Prometheus, just click "Status - Service discovery"
-
You may set it to "solved"

-
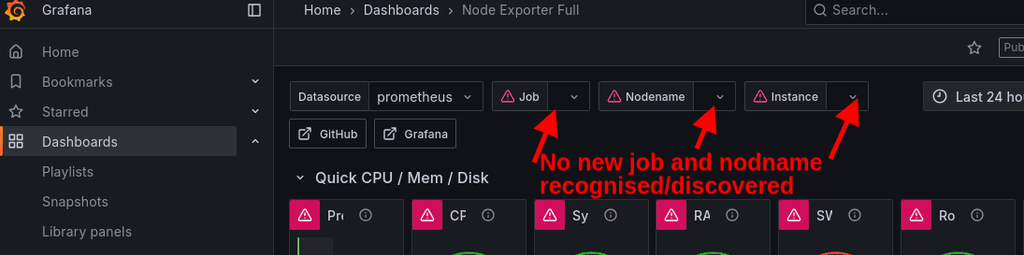
Hmm....Grafana seems not to pick up on the new sources. And I cant find any refresh/reload button in Grafana. Any advice?
-
Hmm....Grafana seems not to pick up on the new sources. And I cant find any refresh/reload button in Grafana. Any advice?
-
Yes, restarted both after updating "Status - Service discovery" in Prometheus. Even deleted the "prometheus" in Grafana and loaded a new one. It did not pick up on the new services in Prometheus
-
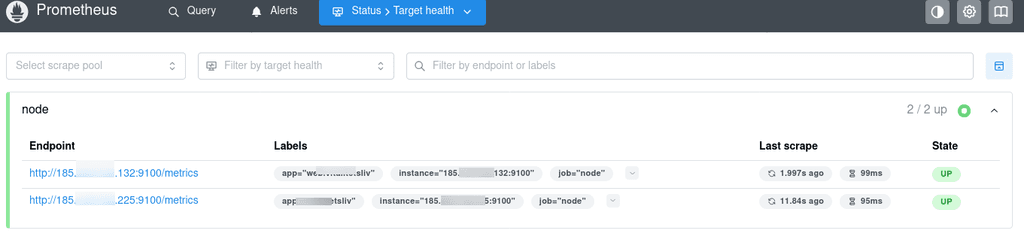
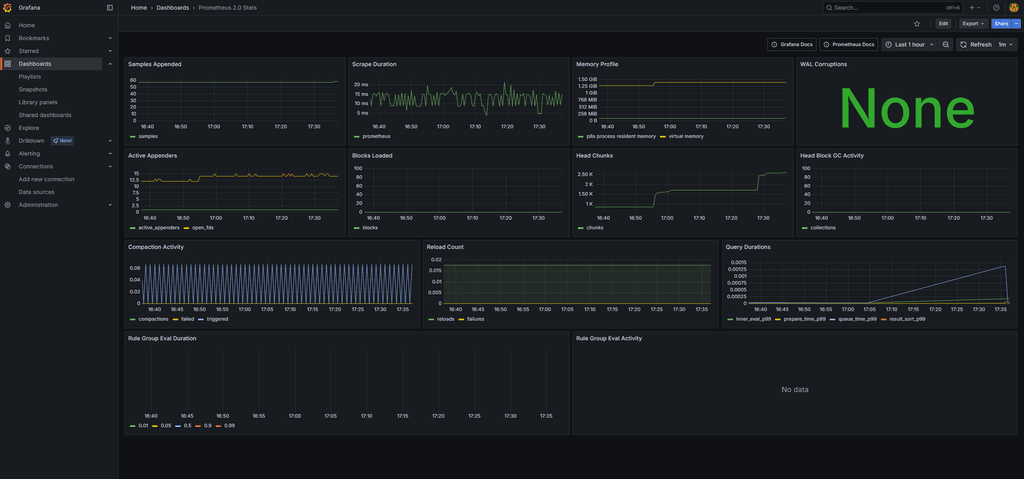
As you see, I have two new endpoints recogniced by Prometheus, but Grafana will not pick up that information
-
-
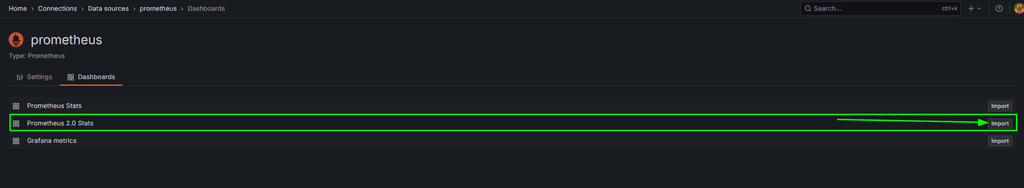
I did a brutal problemsolving hack, deleted Grafana and reinstalled it. Now it works.
I think it may have been the "Node Exporter Full" dashboard that was holding the old config in cache, I may have solved it just by deleting the Node Exporter Full and then reinstalled it.
-
@james How do I do that? And is it needed? I have solved the problem?
Hello! It looks like you're interested in this conversation, but you don't have an account yet.
Getting fed up of having to scroll through the same posts each visit? When you register for an account, you'll always come back to exactly where you were before, and choose to be notified of new replies (either via email, or push notification). You'll also be able to save bookmarks and upvote posts to show your appreciation to other community members.
With your input, this post could be even better 💗
Register Login