CPU avg 25% with just one Active invoice
-
I'm curious if anyone has any insights as to why my invoice ninja would be using an average of 25% CPU for hours, sometimes days, with only one active invoice and practically no user/client activity. It seems to me it should be idle. Thanks for any insight. Thanks
I'm using the current version 5.11.80 -
I'll have to learn how to look back at the logs. For years everything was fine and stable so I didn't get into the tech much.
For the past month the whole system has been going crazy every few days. The CPU would go to 137% for over an hour and nothing was accessible. The cloudron-support --troubleshoot would slowly show everything was ok, with an added 'fgets: Connection reset by peer'. Everything would eventually come back to life.
I keep hoping an update from an app or Ubuntu would fix it. Next time it happens I'll check top/htop live.
Now updated to 5.11.82
-
I'll have to learn how to look back at the logs. For years everything was fine and stable so I didn't get into the tech much.
For the past month the whole system has been going crazy every few days. The CPU would go to 137% for over an hour and nothing was accessible. The cloudron-support --troubleshoot would slowly show everything was ok, with an added 'fgets: Connection reset by peer'. Everything would eventually come back to life.
I keep hoping an update from an app or Ubuntu would fix it. Next time it happens I'll check top/htop live.
Now updated to 5.11.82
Hello @techy
This might not be the case for you, just a cautious tale that high CPU usage / load can also be caused by something completely different.
Recently I had a VPS system that had a ridiculous high load without doing anything special.
And it was suddenly, from one day to another.
Thanks to excessive monitoring I could see that theIOWAITwas suddenly extremely high.
It turned out, the underlaying RAID from the provider had multiple failing disks and that is why my VM was having such trouble with the Disk. -
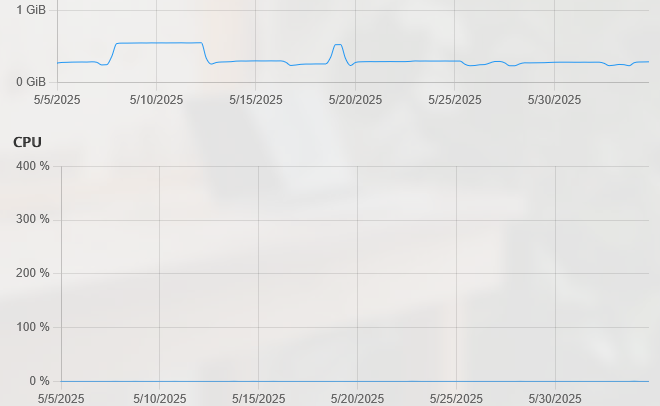
IN never registers any usage spikes for me even when there's traffic/usage. The 30 day graph is consistently low. The RAM is under 300 MB idle with spikes of 550MB and CPU is 0.2%. The app's been pretty solid if you don't account for the occasional PDF issues. @james might be on to something.
-
Hello @techy
This might not be the case for you, just a cautious tale that high CPU usage / load can also be caused by something completely different.
Recently I had a VPS system that had a ridiculous high load without doing anything special.
And it was suddenly, from one day to another.
Thanks to excessive monitoring I could see that theIOWAITwas suddenly extremely high.
It turned out, the underlaying RAID from the provider had multiple failing disks and that is why my VM was having such trouble with the Disk.@james Thanks for the suggestion. I setup a support ticket with Linode and they responded back that everything looked good hardware wise. They gave me the following suggested commands to check the system:
Check for steal percentages by reviewing the %steal values from the following command:
iostat 1 10Check for processes stuck in a 'D' state :
for x inseq 1 1 30; do ps -eo state,pid,cmd | grep "^D"; echo "-"; sleep 2; doneInvestigate processes using the most CPU time:
top -bn 1 | head -15Additionally, you can run this command during the excessive CPU usage:
ps fax o uid,%cpu,%mem,time,comm | awk '0+$0 == 999 {print}Everything checked out normal. I'll keep an eye on it.
-
IN never registers any usage spikes for me even when there's traffic/usage. The 30 day graph is consistently low. The RAM is under 300 MB idle with spikes of 550MB and CPU is 0.2%. The app's been pretty solid if you don't account for the occasional PDF issues. @james might be on to something.
@humptydumpty Thanks for the insight. Yeah, it has been pretty stable over the years. And the pdf issue is an easy enough fix when it happens.
I wonder if my payment provider Stripe could be querring my data and causing this. Any ideas on how to check that?
Thanks
-
@humptydumpty Thanks for the insight. Yeah, it has been pretty stable over the years. And the pdf issue is an easy enough fix when it happens.
I wonder if my payment provider Stripe could be querring my data and causing this. Any ideas on how to check that?
Thanks
Hello! It looks like you're interested in this conversation, but you don't have an account yet.
Getting fed up of having to scroll through the same posts each visit? When you register for an account, you'll always come back to exactly where you were before, and choose to be notified of new replies (either via email, or push notification). You'll also be able to save bookmarks and upvote posts to show your appreciation to other community members.
With your input, this post could be even better 💗
Register Login