Cloudron makes it easy to run web apps like WordPress, Nextcloud, GitLab on your server. Find out more or install now.


Skip to content
  • 1 Votes
    12 Posts
    127 Views
    U
    Happy to report that the updated cal.com package seems to have fixed the underlying server issue. Many thanks,
  • 0 Votes
    16 Posts
    314 Views
    P
    @james for sure: Hetzner vServer CPU4 Core "AMD EPYC-Milan Processor" Memory16.37 GB RAM & 4.29 GB Swap Cloudron v8.3.2 on Ubuntu 22.04.5 LTS Allocated Ram: 4GB Websites monitored: 150 each 12 hours
  • CPU avg 25% with just one Active invoice

    Invoice Ninja performance
    8
    1 Votes
    8 Posts
    331 Views
    humptydumptyH
    @techy I use Stripe too, but no clue how to check for that.
  • Superuser Auth API Response Became Extremely Slow

    PocketBase performance
    2
    0 Votes
    2 Posts
    117 Views
    jamesJ
    Hello @digago-gh @digago-gh said in Superuser Auth API Response Became Extremely Slow: Superuser logins now take noticeably longer compared to earlier versions. If you can reliably compare across version. This might be an upstream issue. @digago-gh said in Superuser Auth API Response Became Extremely Slow: Was there a recent structural change in how superuser sessions are created or verified? All changes for app updates done by Cloudron is documented in either the changelog when updating the app or here in the forum. https://forum.cloudron.io/topic/11735/pocketbase-package-updates Even further the code commits for versions can be reviews here: https://git.cloudron.io/packages/pocketbase-app/-/commits/main Bases on that, I can not reliably tell you yes or no. @digago-gh said in Superuser Auth API Response Became Extremely Slow: Is this expected behavior (e.g., for added security/logging), or is it an unintended performance regression? Needs to be evaluated, either upstream or here. Can you provide some logs of the app with "old version" fast and "new version" slow? @digago-gh said in Superuser Auth API Response Became Extremely Slow: Are there any known workarounds or config settings we can tweak to mitigate the delay? I don't think so but, you can search in the official documentation for something related to your issue. => https://pocketbase.io/docs/
  • 2 Votes
    7 Posts
    337 Views
    jamesJ
    Hello @i.fritz Thanks for providing these details. Inside you config I can see something shady: MinSpareServers 20 MaxSpareServers 20 But MaxSpareServers should be MaxSpareServers >= MinSpareServers+1 so at least 21. Just in case this could cause any issues. @i.fritz said in Nextcloud Talk CHAT very slow: 
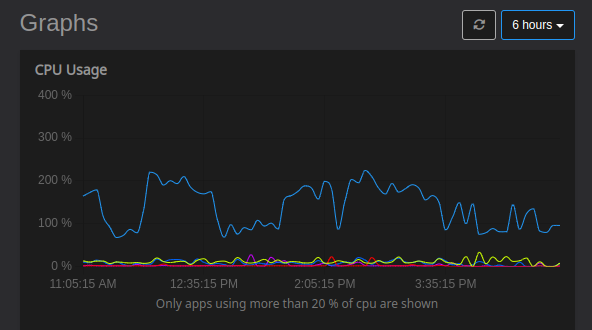
I see CPU at a lot of Apache processes As expected when you start StartServers 50 and a minimum of MinSpareServers 20 so at least 70 processes. So maybe this config is already a bit shady. <!-- Disclaimer - the following contains partly AI generated content --!> I've done my due diligance to confirm that everything is correct and sane. Made the AI format my sloppy text into something readable. <!-- End of disclaimer --!> For a Nextcloud setup with 100+ users, the Apache prefork MPM settings should balance performance, stability, and resource efficiency. Below are recommended values based on typical production environments, alongside key considerations: Recommended Apache Prefork Settings <IfModule mpm_prefork_module> StartServers 5 MinSpareServers 5 MaxSpareServers 10 MaxRequestWorkers 100 # Previously "MaxClients" MaxConnectionsPerChild 5000 </IfModule> Explanation & Rationale StartServers 5 Initial processes to handle traffic spikes at startup. Why? Avoids delay in spawning processes during sudden load. MinSpareServers 5 MaxSpareServers 10 Maintains 5–10 idle processes to absorb traffic surges. Why? Prevents latency by keeping workers ready. For 100+ users, higher spares reduce wait times during concurrency peaks. MaxRequestWorkers 100 Maximum simultaneous requests. Why? Assumes 10–20% concurrent active users (10–20 requests at peak). Each user may open 2–5 connections (pages, syncs, uploads). Adjust based on RAM: Estimate RAM/process: Minimal: 30–50 MB (optimized PHP). Typical: 70–150 MB (with PHP modules). Formula: MaxRequestWorkers = (Available RAM for Apache) / (Average PHP process size) Example: 8 GB RAM server → Reserve 4 GB for Apache → 4000 MB / 50 MB ≈ 80 workers. Start with 100, monitor, and adjust. MaxConnectionsPerChild 5000 Recycle processes after 5000 requests. Why? Prevents memory leaks without excessive process recycling. Avoid values <1000 (causes frequent restart overhead). Values >10k are acceptable if leaks are minimal. Critical Considerations PHP Memory: Set php.ini values:max_execution_time = 300 ; For large uploads/ops Cloudron sets this for PHP by default: RUN crudini --set /etc/php/8.3/apache2/php.ini PHP upload_max_filesize 5G && \ crudini --set /etc/php/8.3/apache2/php.ini PHP post_max_size 5G && \ crudini --set /etc/php/8.3/apache2/php.ini PHP memory_limit 512M && \ crudini --set /etc/php/8.3/apache2/php.ini opcache opcache.enable 1 && \ crudini --set /etc/php/8.3/apache2/php.ini opcache opcache.enable_cli 1 && \ crudini --set /etc/php/8.3/apache2/php.ini opcache opcache.interned_strings_buffer 32 && \ crudini --set /etc/php/8.3/apache2/php.ini opcache opcache.max_accelerated_files 10000 && \ crudini --set /etc/php/8.3/apache2/php.ini opcache opcache.memory_consumption 128 && \ crudini --set /etc/php/8.3/apache2/php.ini opcache opcache.save_comments 1 && \ crudini --set /etc/php/8.3/apache2/php.ini opcache opcache.revalidate_freq 1 && \ crudini --set /etc/php/8.3/apache2/php.ini Session session.save_path /run/nextcloud/sessions && \ crudini --set /etc/php/8.3/apache2/php.ini Session session.gc_probability 1 && \ crudini --set /etc/php/8.3/apache2/php.ini Session session.gc_divisor 100 Adjustment Workflow Start with recommended values. Simulate load with tools like ab:ab -n 1000 -c 50 https://your-nextcloud.com/ Note: Do not start the load test from your desktop machine at home or the Nextcloud server itself. It should be a VM with enough power. Maybe rent a bigger Hetzner vServer for 30–60 minutes to do the load test against your Nextcloud.
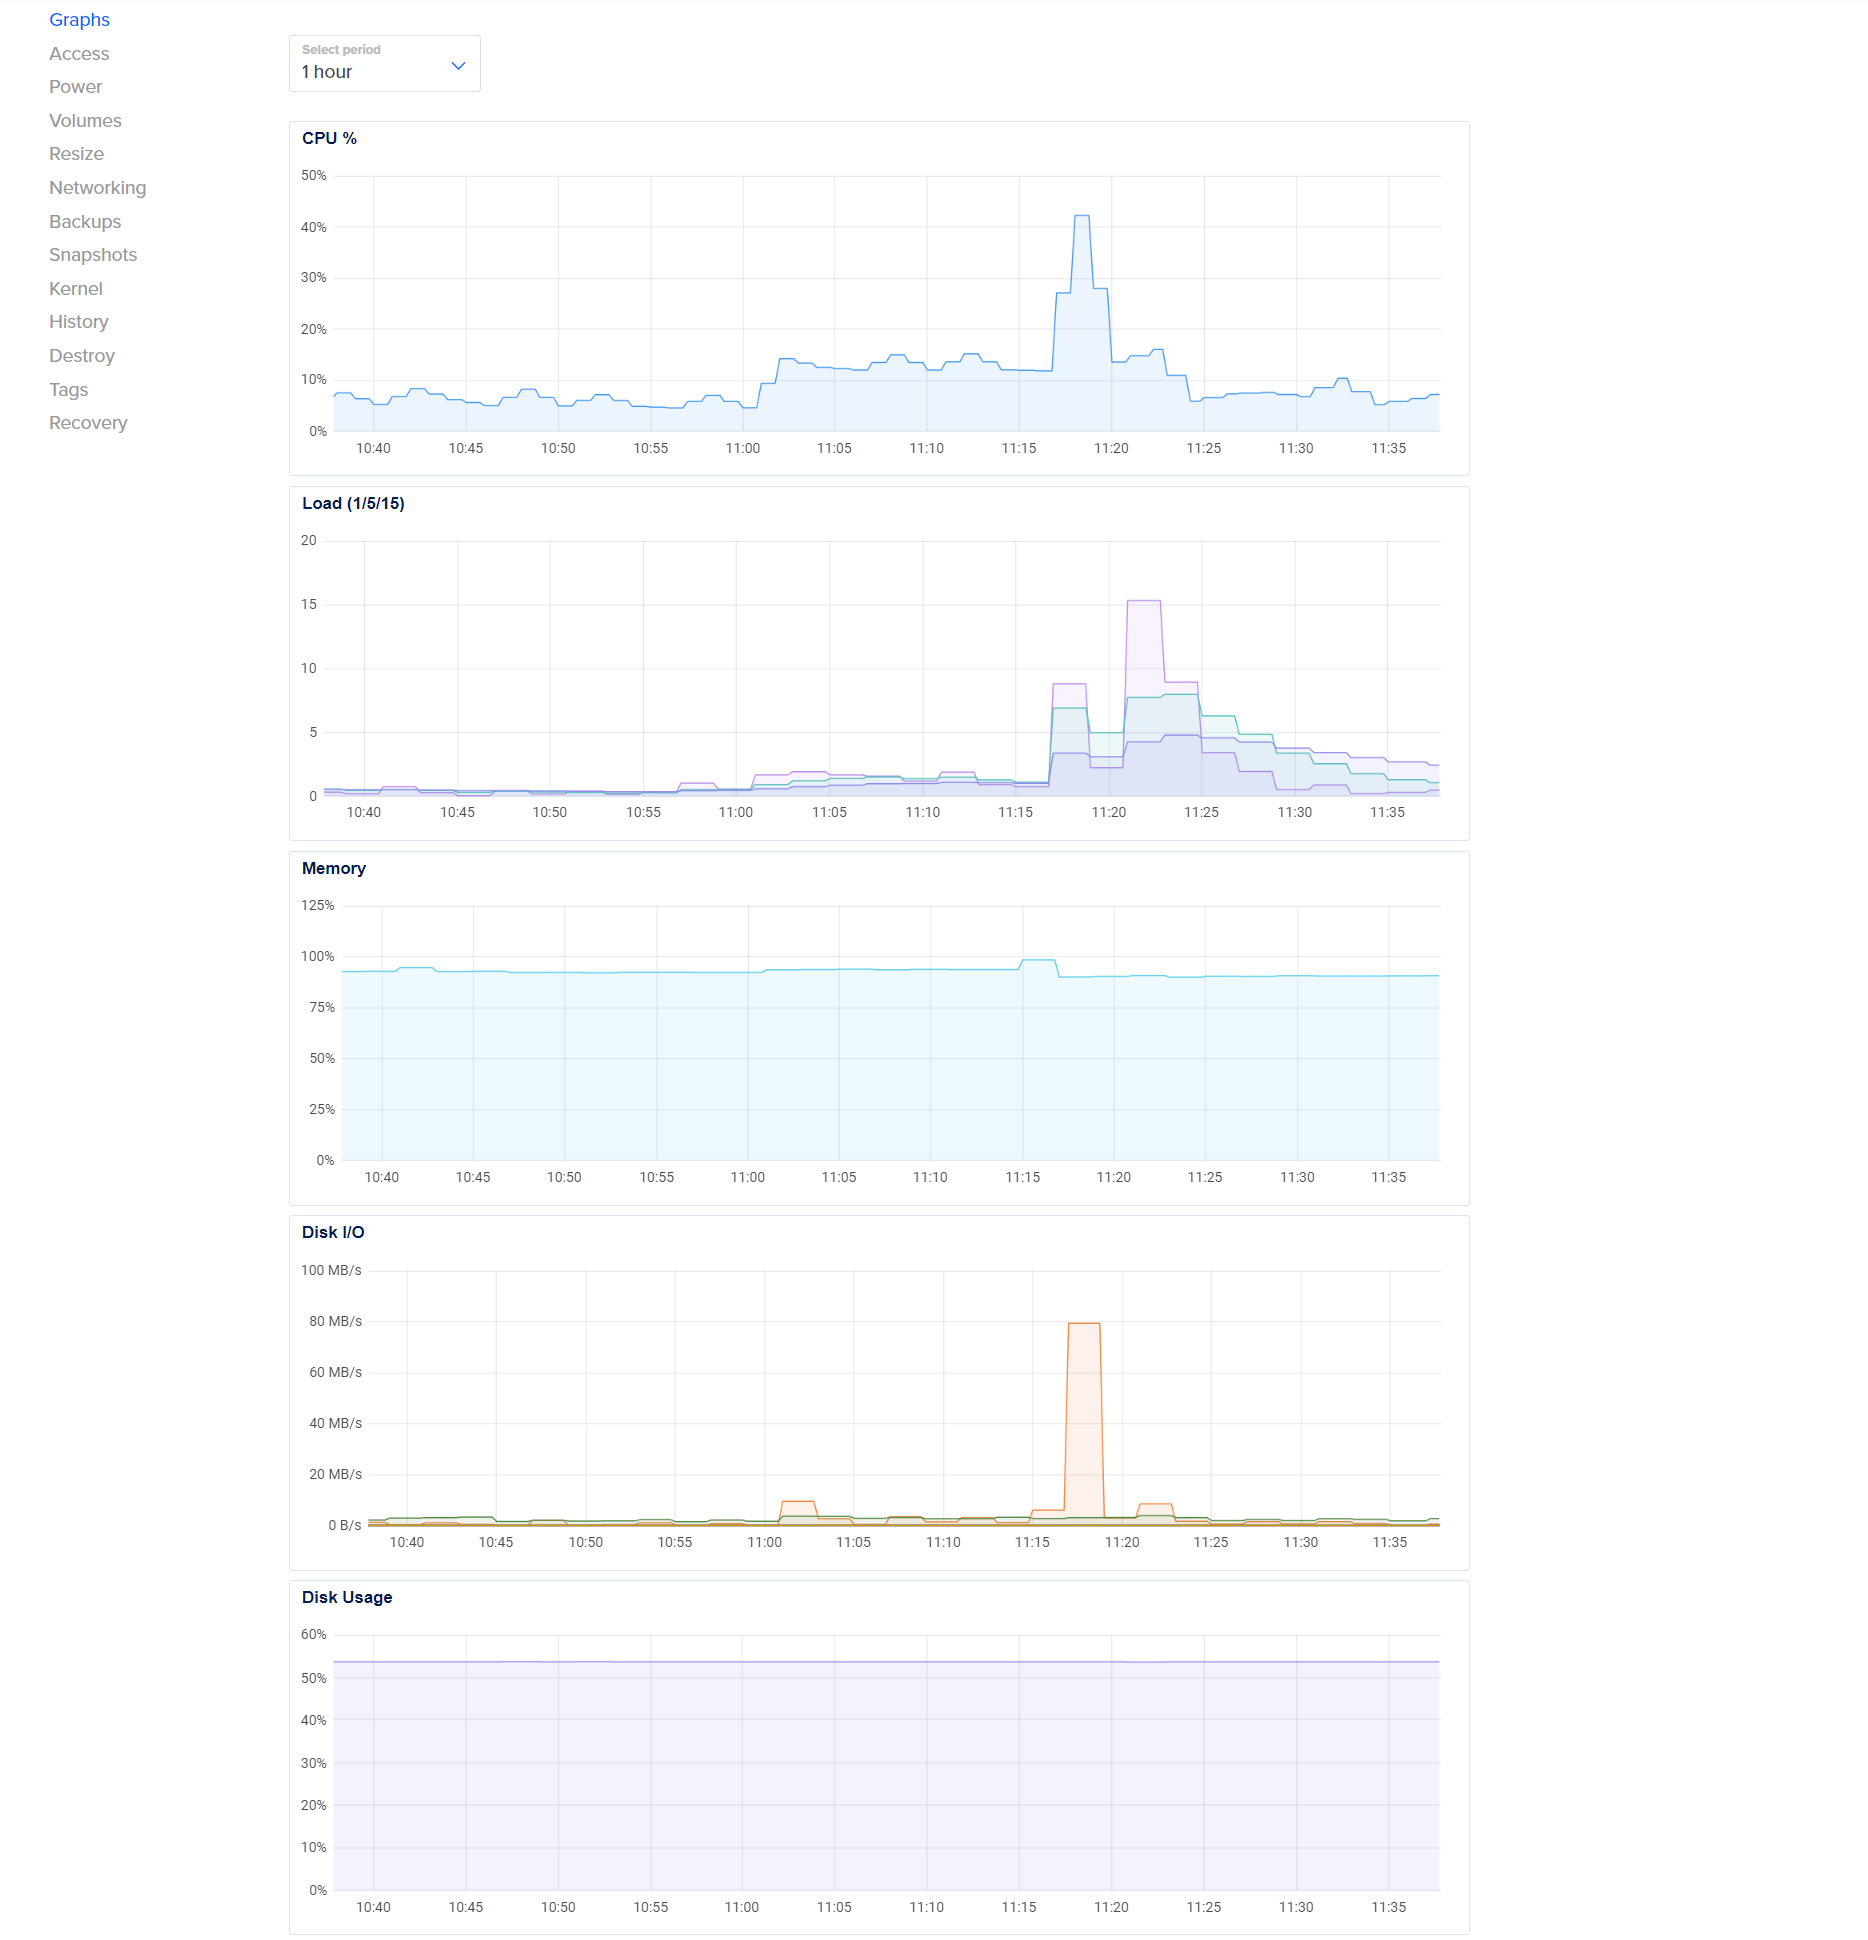
 Monitor: RAM usage (avoid >70% total usage). Idle workers (should rarely hit 0). Queue length (via mod_status; requests waiting for workers). Scale incrementally: Increase MaxRequestWorkers if queues form. Reduce MaxSpareServers if idle processes waste RAM. With these setting your Nextcloud should at least be assigned 8GB RAM, but since you have 128 GB why not give it 12GB. This might already help.
  • High memory usage and slow Cloudron after reboot for update

    Solved Support performance memory
    5
    0 Votes
    5 Posts
    454 Views
    P
    @nebulon Yes, I had a look of Cpu load and it was by msql, but now seems to be ok
  • Cloudron services are slow

    Solved Support performance
    14
    0 Votes
    14 Posts
    2k Views
    micmcM
    @jdaviescoates said in Cloudron services are slow: @nebulon @KhalilZammeli said in Cloudron services are slow: update of the screenshot for our wordpress service, very high CPU usage, how can we investigate these ? Given the above and the fact WordPress uses mysql (and is very often attacked as it's so widely used, and malicious plugins are also quite common) that seem to me to be the obvious first app to investigate. Absolutely! Most of the time a WP plugin is the culprit. A WP plugin that's been acquired through a 'friend' which is not the original developer. Extremely, dangerous these are compromised in 99% of the times.
  • System Info - CPU Usage chart

    Feature Requests graphs performance
    3
    1
    2 Votes
    3 Posts
    456 Views
    mmolivierM
    Hi @girish that's understandable, profiling is beyond what Cloudron is meant to do. However it would be useful if the charts would be more accurate. Imagine this usecase: You have an install with 10 apps. Suddenly there's a lot of incoming traffic on one of these apps, slowing the entire machine down. If this happens, at least you'd want to be able to quickly identify the app which should be stopped. Anyways, it's understandable that this doesn't get much priority given the amazing popularity on this thread
  • 2 Votes
    17 Posts
    3k Views
    girishG
    @robi @d19dotca identified the issue at https://forum.cloudron.io/topic/10434/email-event-log-loading-very-slowly-seems-tied-to-overall-email-domain-list-health-checks/9 . When we switch views, pending http requests of the old view are not canceled .
  • 0 Votes
    2 Posts
    364 Views
    girishG
    Right, the historic graphs data is not retained since it's all very server specific. And most likely won't even map properly to the new server. I can put a note in the docs.
  • Cloudron performance issues

    Solved Support graphs performance
    20
    5
    0 Votes
    20 Posts
    3k Views
    timconsidineT
    Understood. I am in UK but use Hetzner in DE, and don't have any performance issues.
  • Multicore vs Single-Core

    Solved Support performance cpu
    4
    2 Votes
    4 Posts
    3k Views
    StardenverS
    That's what I call an answer Thank you very much. Very helpful and my question is answered.
  • Identify whats causing lags

    Support performance netcup
    11
    1 Votes
    11 Posts
    2k Views
    nichu42N
    @Stardenver said in Identify whats causing lags: So the graph showing 200% is 2 cores on 100% each (or something equal like 4 cores on 50% each)? The latter is more probable. If you really want to know, run 'htop' from the command line.
  • MySQL real-time monitoring tool

    Support performance mysql monitoring
    2
    0 Votes
    2 Posts
    571 Views
    marcusquinnM
    @vladimir-d DBeaver Database Dashboard? Or you thinking longer timeframe and more detail?
  • Cloudron super slow and crashes at least once a month

    Solved Support ec2 aws performance
    5
    0 Votes
    5 Posts
    1k Views
    girishG
    @dreamcatch22 with AWS, I have usually found that it's either a) the cpu credits are kicking in. are you aware of https://docs.aws.amazon.com/AWSEC2/latest/UserGuide/burstable-credits-baseline-concepts.html ? AFAIK, even lightsail has the same limitation (but not 100% sure). b) some machine have a lot of memory but perform very poorly . For example, see the notes in EC2 R5 xlarge (which has 32GB RAM!) but works very poorly with docker - https://forum.cloudron.io/post/17488 Not sure, if either of those apply to you. What instance are you using ?
  • 3 Votes
    27 Posts
    4k Views
    MooCloud_MattM
    @lonk said in Apache, OLS and Nginx-Custom Benchmarks: redis is already apart of Cloudron Yes & no, Yes is part of the cloudron addon, but it can be integrated in different way. You can use it for dynamic cache (as cloudron use in there apps), behind the php, db lvl. You can use it as a Full Page Cache (similar to what Cache Enebler do but in RAM and not in local disc). php lvl You can use it for partial page caching, in this case is at webserver/proxy lvl. Redis is just a "database" in RAM, you can use it to store what you want, Redis is not a cache, but you can use it as it was one.
  • Performance Tuning

    Discuss performance tuning
    5
    2 Votes
    5 Posts
    1k Views
    robiR
    @d19dotca Can't tell as I haven't run out of RAM yet.. huge machines.. ;-/ Best to try on smaller ones.
  • 1 Votes
    11 Posts
    2k Views
    LonkleL
    @fbartels said in MySQL tuning with my.cnf settings optimisation: @lonk said in MySQL tuning with my.cnf settings optimisation: when do we run / apply it? Mysql tuning is best applied after a few days of database usage. Applications usually have different load patterns. Gotcha, thanks for the tip! ️
  • CPU share higher or lower for less priority

    Solved Support performance cpu shares
    2
    1 Votes
    2 Posts
    561 Views
    girishG
    The CPU share setting is a percentage relative to each app. So, you should make tinytinyrss slider to be 20%. That way, it will take less CPU compared to other apps (which are set to default to 80%). There's a more detailed explanation here - https://www.batey.info/cgroup-cpu-shares-for-docker.html . When 50%, we set the CPU shares value to be 50% of 1024, when 20%, we set the CPU shares to 20% of 1024 and so on.