@james
The "earlier" HumHub installation was installed more than a year ago, but have been updated as new appversions has arrived, so today it is latest 1.17.4 (app version 1.8.3).
It has modules installed, but only the standard modules that everyone can install for free. And none of them modify the standard profile fields.
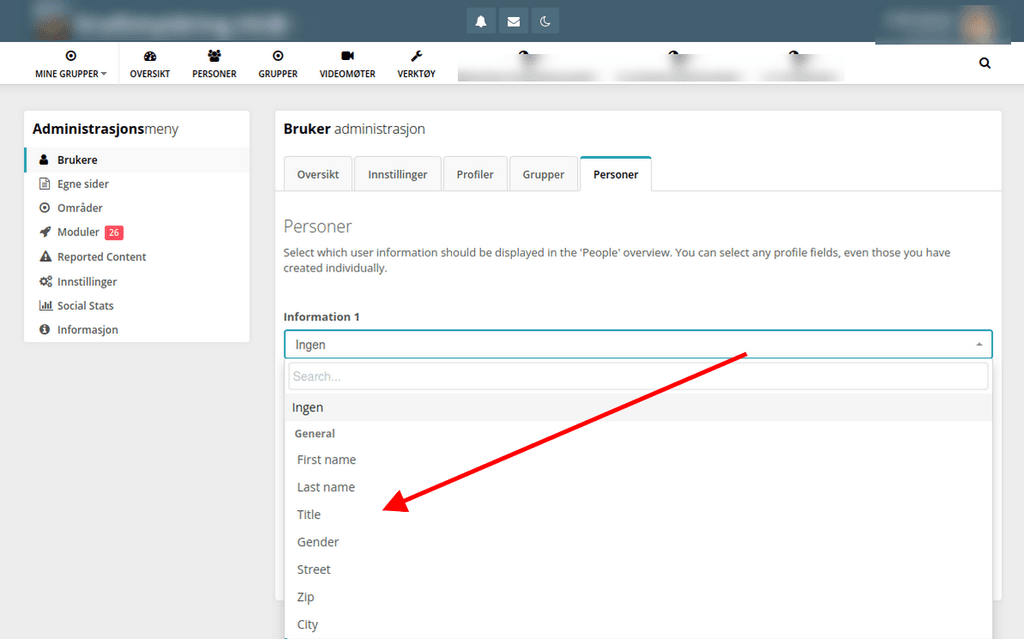
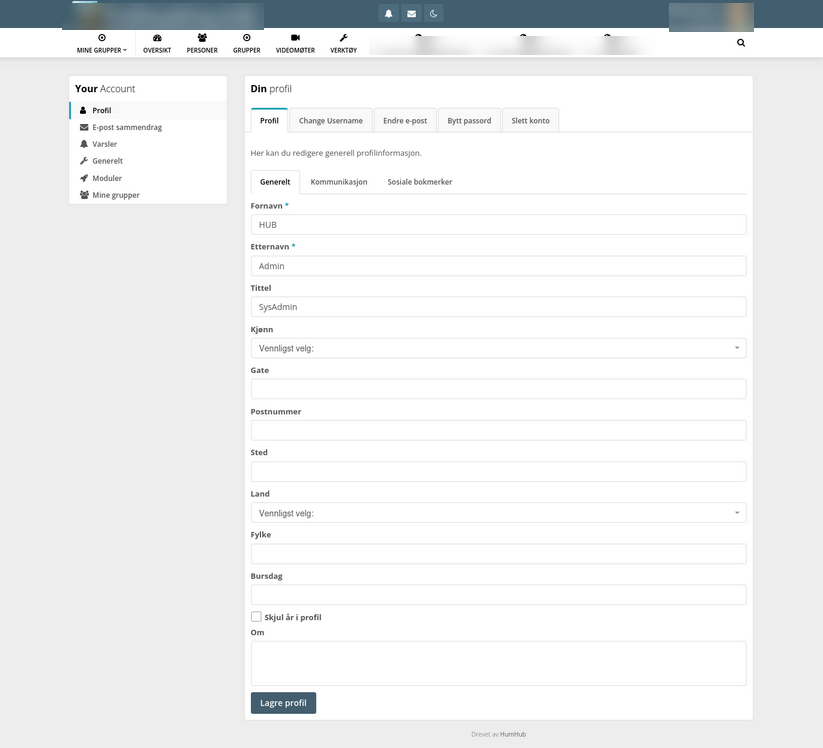
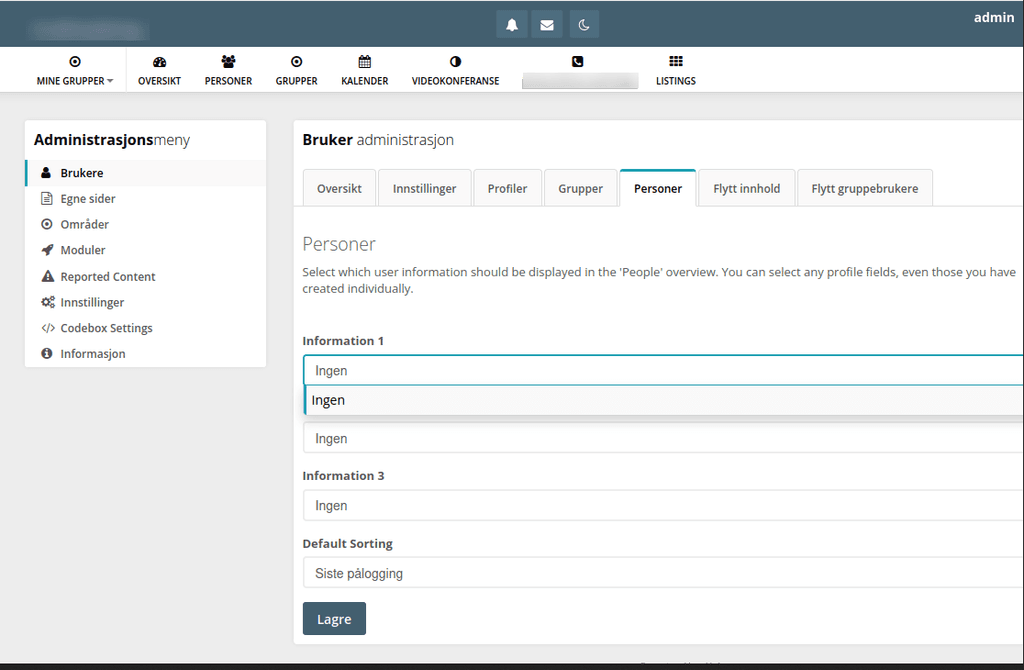
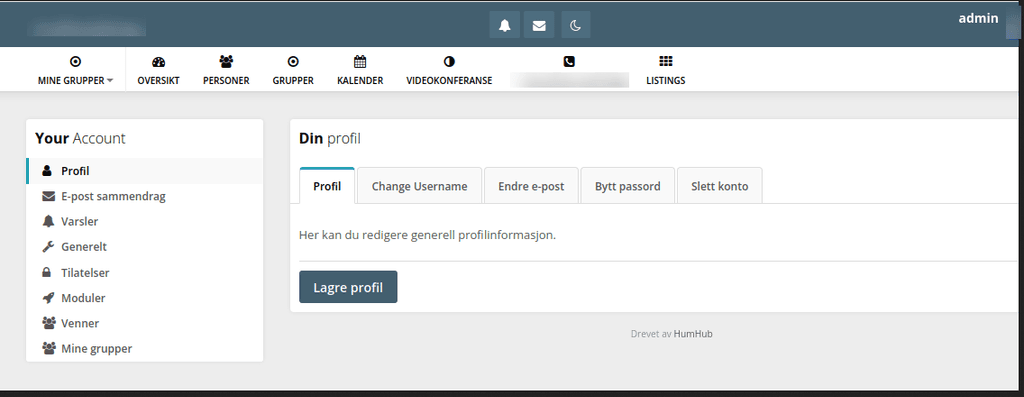
Also, a standard HumHub installation done the traditional way comes with preconfigured standard profile fields. I find it very strange and unlikely that the cloudron version of the HumHub has gotten the profile fields stripped away "by intelligent design". If so, then why?
So something is probably wrong with the cloudronapp itself, as I have tried to install it on two different cloudrons that reside on two different DO droplets, and both show the same lack of profile fields.
This error also created a lot of other problems, but I think it is a waste of time trying to discuss those at this stage. First I need to figure out why the installation has no preconfigured profile fields, and if that result is not intended and can be fixed in the app-packaging so the installation can be done complete, then the other errors may be fixed as well.