Feedback on new graphs in 7.3.2
-
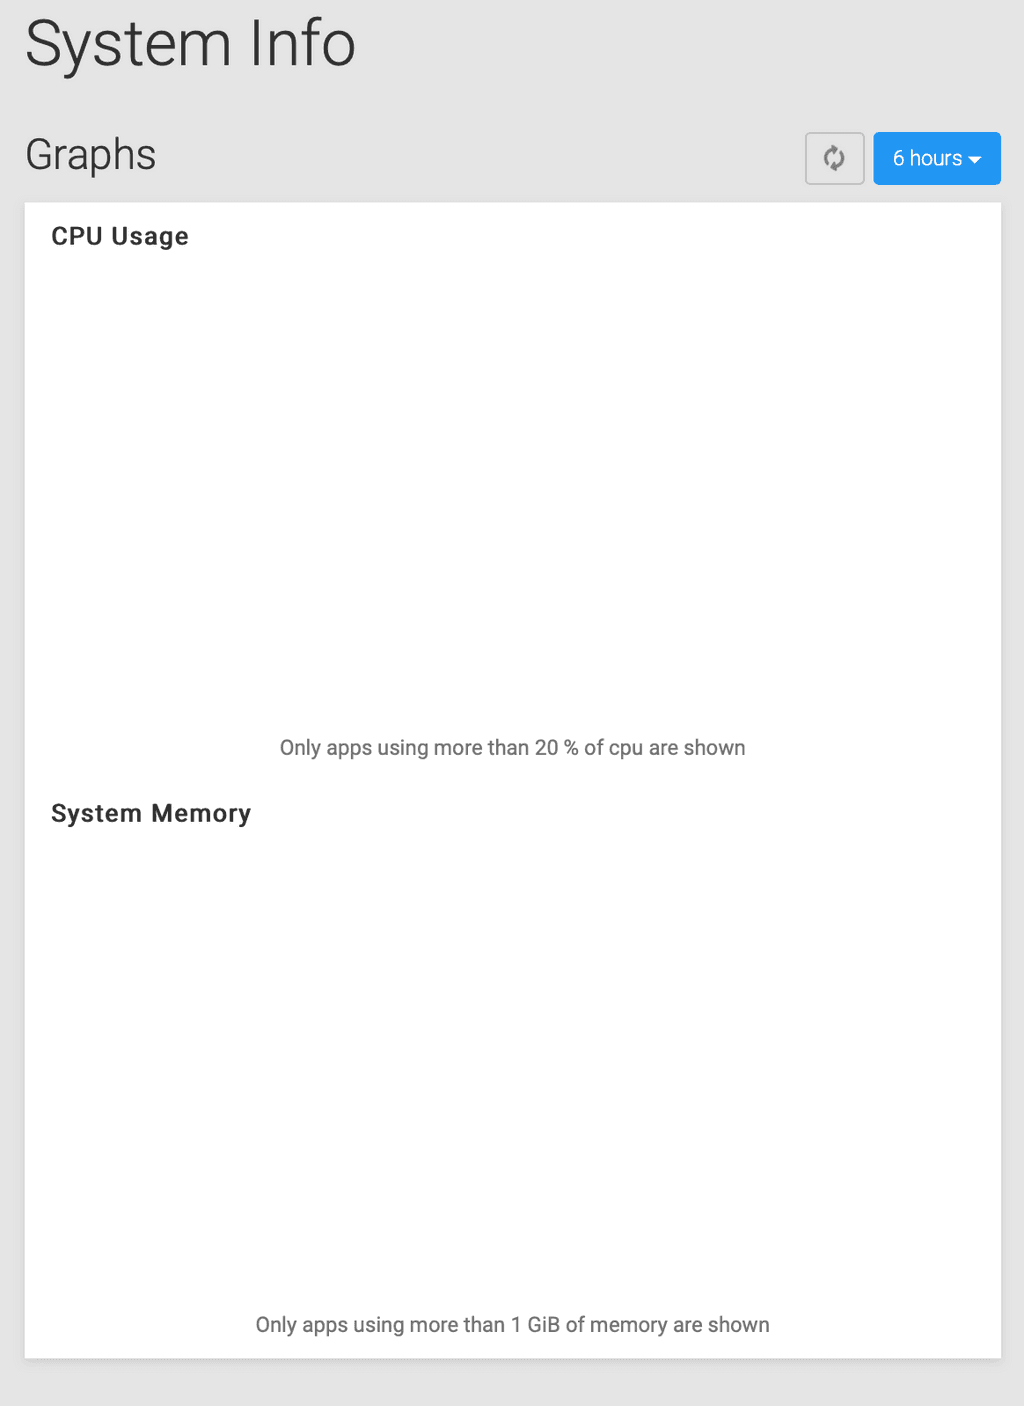
In 7.3.2, the graphs were overhauled a bit on the Systems page. Definitely some nice improvements, however I noticed that the CPU & Memory graphs reload on every single refresh of the browser / load of that page, which makes it look like it's not doing anything (beyond the refresh button rotating) for several seconds. The disk space graph doesn't do that and seems 100% manual. This leads to inconsistencies in the graphs.

What I'd propose is to perhaps have either all graphs load concurrently on refresh of the page (and maybe a dimmed overlay with a note about it collecting metrics, please wait sort of thing), but I think I'd prefer option #2 which would be to only automatically refresh if it's been more than say 60 minutes since the last collection time otherwise keep it always loaded from the previous collected stats. I think this would lead to a better UX by having somewhat current stats available right away or at least a message about it collecting new stats while it's running.
Or perhaps a third option might be better where it always shows the latest stats while also running a refresh behind the scenes where it then updates the graphs when it's done, that way the graphs always have at least some data shown at all times?
Just something to consider anyways. Nothing major, but wanted to write this up.

-
The disk usage graph data is only on demand (i.e it is not collected over time periodically).
The cpu and memory data is collected over time. I think what you are seeing here is that the query is taking a long time to load since it requests the data for each app individually. I will see if we can parallelize the queries so that the page loads faster.
Hello! It looks like you're interested in this conversation, but you don't have an account yet.
Getting fed up of having to scroll through the same posts each visit? When you register for an account, you'll always come back to exactly where you were before, and choose to be notified of new replies (either via email, or push notification). You'll also be able to save bookmarks and upvote posts to show your appreciation to other community members.
With your input, this post could be even better 💗
Register Login
