Cloudron v9: huge disk I/O is this normal/safe/needed?
-
It’s a production server, isn’t it ridiculous to stop these apps to watch resource behavior? There must be tools or ways to find the root cause don’t you think?
Beside that it’s the host MySQL does it has anything to do with apps?
-
Hello @imc67
You can use the PID from the process to figure out what mysql service it is.e.g. your
iotopshows formysqldthe pid1994756.
You can runsystemctl status mysql.serviceand there is the pid displayed:● mysql.service - MySQL Community Server Loaded: loaded (/usr/lib/systemd/system/mysql.service; enabled; preset: enabled) Active: active (running) since Mon 2025-12-01 09:17:59 UTC; 1 week 5 days ago Main PID: 1994756 (mysqld) Status: "Server is operational" Tasks: 48 (limit: 4603) Memory: 178.7M (peak: 298.0M swap: 95.4M swap peak: 108.7M) CPU: 1h 41min 31.520s CGroup: /system.slice/mysql.service └─1994756 /usr/sbin/mysqld Notice: journal has been rotated since unit was started, output may be incomplete.So from
iotopI can confirm that the system mysqld service is pid1994756so I'd know to inspect the system mysqld service and not the docker mysql service.You can also get the pid from the
mysqldinside the docker container withdocker top mysql:docker top mysql UID PID PPID C STIME TTY TIME CMD root 1889 1512 0 Nov07 ? 00:06:17 /usr/bin/python3 /usr/bin/supervisord --configuration /etc/supervisor/supervisord.conf --nodaemon -i Mysql usbmux 3079 1889 0 Nov07 ? 03:49:38 /usr/sbin/mysqld usbmux 3099 1889 0 Nov07 ? 00:00:11 node /app/code/service.jsThen I know the
mysqldpid of the docker service is3079which I can check again with the system:ps uax | grep -i 3079 usbmux 3079 0.4 1.0 1587720 43692 ? Sl Nov07 229:38 /usr/sbin/mysqldNow we can differentiate between the two.
Okay.
Now that we can differentiate between the two, you can observeiotopand see which one has a high I/O.
After you narrow it down to either one, then we can do some analysis what database / table get accesses the most even further narrow it down. -
Ok, thanks for your hints!!
The result was
PID 19974However:
● mysql.service - MySQL Community Server
     Loaded: loaded (/lib/systemd/system/mysql.service; enabled; vendor preset: enabled)
     Active: active (running) since Sat 2025-12-13 05:57:30 UTC; 1 day 5h ago
    Process: 874 ExecStartPre=/usr/share/mysql/mysql-systemd-start pre (code=exited, status=0/SUCCESS)
   Main PID: 910 (mysqld)
     Status: "Server is operational"
      Tasks: 47 (limit: 77023)
     Memory: 601.7M
        CPU: 59min 14.538s
     CGroup: /system.slice/mysql.service
             └─910 /usr/sbin/mysqld
And
docker top mysqlUID PID PPID C STIME TTY TIME CMD root 9842 8908 0 Dec13 ? 00:00:17 /usr/bin/python3 /usr/bin/supervisord --configuration /etc/supervisor/supervisord.conf --nodaemon -i Mysql message+ 19974 9842 6 Dec13 ? 01:56:43 /usr/sbin/mysqld message+ 19976 9842 0 Dec13 ? 00:01:31 node /app/code/service.jsSo
ps uax | grep -i 19974gives:message+ 19974 6.6 1.8 4249604 1229136 ? Sl Dec13 116:48 /usr/sbin/mysqldSo at least we now know that it's the Docker MySQL
-
Hello @imc67
Now we can start analysing.
Edit the file/home/yellowtent/platformdata/mysql/custom.cnfand add the following lines:[mysqld] general_log = 1 slow_query_log = 1Restart the MySQL service in the Cloudron Dashboard.
The log files are stored at/home/yellowtent/platformdata/mysql/mysql.logand/home/yellowtent/platformdata/mysql/mysql-slow.log.Let it run for a day or more.
Then you can download the log files and see what queries run very often causing disk I/O. -
I enabled this en within seconds the log file was enormous, I asked ChatGPT to analyse it and here is it's observations: (too technical for me):
Some observations after briefly enabling the MySQL general log (Cloudron v9)
I enabled the MySQL general log only for a short time because of disk I/O concerns, but even within a few minutes a clear pattern showed up.
What I’m seeing:
- A very high number of
INSERT INTO session (...)and
INSERT ... ON DUPLICATE KEY UPDATE - These happen continuously and come from
172.18.0.1 - As far as I understand, this IP is the Docker bridge gateway in Cloudron, so it likely represents multiple apps
I temporarily disabled Matomo to rule that out, but disk I/O and session-related writes did not noticeably decrease, so it does not seem to be the main contributor.
From the log it looks like:
- Multiple applications are storing sessions in MySQL
- Session rows are updated on almost every request
- This can generate a lot of InnoDB redo log and disk I/O, even with low traffic
Nothing looks obviously broken, but I’m trying to understand whether this level of session write activity is:
- expected behavior in Cloudron v9
- something that can be tuned or configured
- or if there are recommended best practices (e.g. Redis for sessions)
Any guidance on how Cloudron expects apps to handle sessions, or how to reduce unnecessary MySQL write I/O, would be much appreciated.
Thanks for looking into this.
- A very high number of
-
Do you have happen to use nextcloud on the server? I think nextcloud+ldap keeps doing a login request when syncing for each file (which might trigger a login eventlog in mysql)
@joseph said in Cloudron v9: huge disk I/O is this normal/safe/needed?:
Do you have happen to use nextcloud on the server? I think nextcloud+ldap keeps doing a login request when syncing for each file (which might trigger a login eventlog in mysql)
No there is no Nextcloud on this server
-
J joseph has marked this topic as solved on
-
 I imc67 marked this topic as a regular topic on
-
I imc67 marked this topic as a question on
-
@imc67 not sure I remember why
 Does this mean that if you disable matomo temporarily, the disk usage goes down a lot?
Seems easy to fix now that we know the root cause
-
My two cents: as soon as #28 is correct, this should happen with every Cloudron instance that has Matomo (and OIDC enabled). I looked at one of my instances that met the criteria. One of the Matomo instances had about 300 sessions stored in MySQL. The oldest entry is from Feb 26.
So maybe #28 isn't correct, or it's something that only happens on this instance. -
Maybe because the three installs are 5-6 years old and had many many updates/upgrades etc?
can you check how many sessions per hour are being created? Run this query:
sqlSELECT HOUR(FROM_UNIXTIME(modified)) AS hour, COUNT(*) AS sessions FROM `<your_matomo_db>`.session WHERE DATE(FROM_UNIXTIME(modified)) = CURDATE() - INTERVAL 1 DAY GROUP BY hour ORDER BY hour;On my instances this shows exactly 360 per hour = 1 per 10 seconds = health check interval. If yours shows much less, the health checker behaves differently on your setup.
-
Maybe because the three installs are 5-6 years old and had many many updates/upgrades etc?
can you check how many sessions per hour are being created? Run this query:
sqlSELECT HOUR(FROM_UNIXTIME(modified)) AS hour, COUNT(*) AS sessions FROM `<your_matomo_db>`.session WHERE DATE(FROM_UNIXTIME(modified)) = CURDATE() - INTERVAL 1 DAY GROUP BY hour ORDER BY hour;On my instances this shows exactly 360 per hour = 1 per 10 seconds = health check interval. If yours shows much less, the health checker behaves differently on your setup.
@imc67 one app instance (4y old)
+------+----------+
| hour | sessions |
+------+----------+
|    0 |        2 |
|    2 |        1 |
|    7 |        2 |
|    8 |        1 |
|    9 |        1 |
|   13 |        3 |
|   15 |        1 |
|   17 |        3 |
|   19 |        1 |
|   20 |        3 |
|   21 |        4 |
|   22 |        1 |
+------+----------+
different app instance (7y old)
+------+----------+
| hour | sessions |
+------+----------+
|    3 |        1 |
|    5 |        2 |
|   15 |        4 |
|   18 |        2 |
|   19 |        2 |
|   20 |        2 |
|   21 |        4 |
|   22 |        2 |
+------+----------+
health check is every 10 sec.
Mar 07 18:00:50 - - - [07/Mar/2026:17:00:50 +0000] "GET / HTTP/1.1" 302 - "-" "Mozilla (CloudronHealth)" Mar 07 18:00:50 172.18.0.1 - - [07/Mar/2026:17:00:50 +0000] "GET / HTTP/1.1" 302 299 "-" "Mozilla (CloudronHealth)" Mar 07 18:01:00 - - - [07/Mar/2026:17:01:00 +0000] "GET / HTTP/1.1" 302 - "-" "Mozilla (CloudronHealth)" Mar 07 18:01:00 172.18.0.1 - - [07/Mar/2026:17:01:00 +0000] "GET / HTTP/1.1" 302 299 "-" "Mozilla (CloudronHealth)" Mar 07 18:01:10 - - - [07/Mar/2026:17:01:10 +0000] "GET / HTTP/1.1" 302 - "-" "Mozilla (CloudronHealth)" Mar 07 18:01:10 172.18.0.1 - - [07/Mar/2026:17:01:10 +0000] "GET / HTTP/1.1" 302 299 "-" "Mozilla (CloudronHealth)" Mar 07 18:01:20 - - - [07/Mar/2026:17:01:20 +0000] "GET / HTTP/1.1" 302 - "-" "Mozilla (CloudronHealth)" Mar 07 18:01:20 172.18.0.1 - - [07/Mar/2026:17:01:20 +0000] "GET / HTTP/1.1" 302 299 "-" "Mozilla (CloudronHealth)" Mar 07 18:01:30 - - - [07/Mar/2026:17:01:30 +0000] "GET / HTTP/1.1" 302 - "-" "Mozilla (CloudronHealth)" Mar 07 18:01:30 172.18.0.1 - - [07/Mar/2026:17:01:30 +0000] "GET / HTTP/1.1" 302 299 "-" "Mozilla (CloudronHealth)" -
We also found some huge MySQL tables from a Wordpress-app with dedicated MainWP due to incorrect retention settings, after correction and deletion the 1 minute
iotop -aoP -d 5is still:- Docker MySQL: 70 MB
- Host MySQL: 33 MB
- go-carbon: 6.7 MB
- jbd2: 9.9 MB
- Total: ~103 MB per minute
To put this in perspective:
- 103 MB/min = 6.2 GB/hour
- 6.2 GB/hour = 148 GB/day
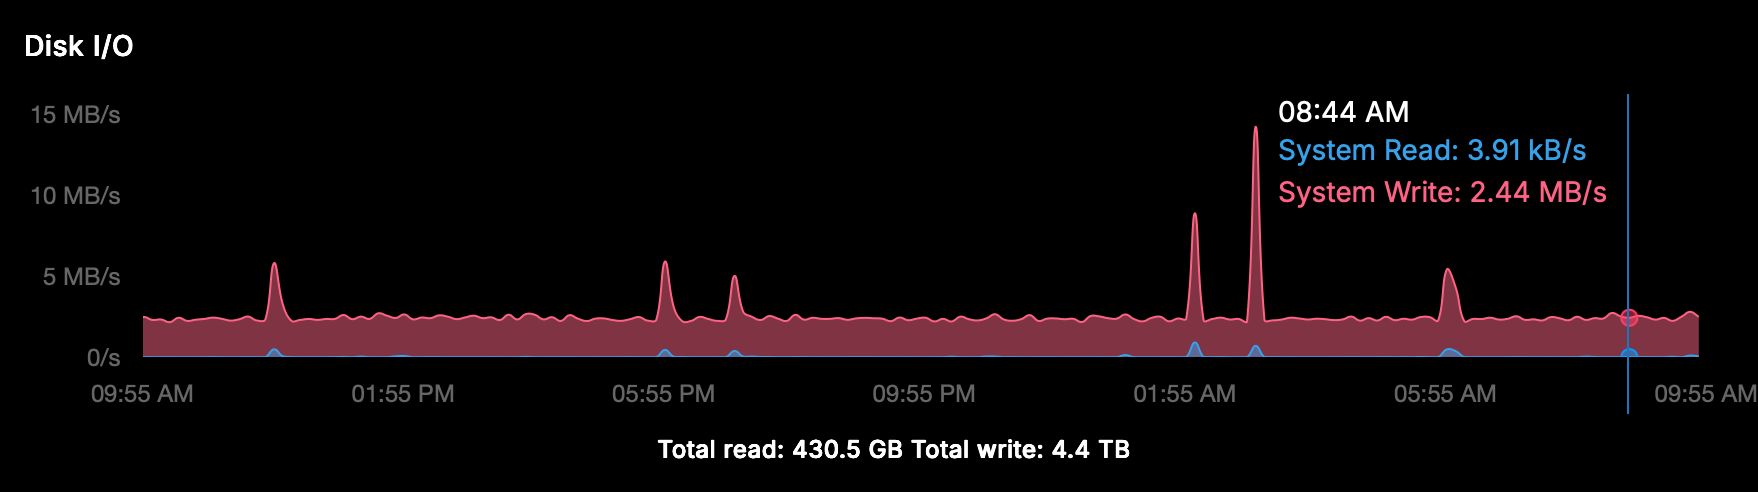
- 148 GB/day = 4.4 TB/month
This is on a server with relatively low visitors across 10 sites. The vast majority of this write activity is caused by the issues identified above (Matomo health checker sessions, box.tasks accumulation, and app-level retention misconfigurations) — not by actual user traffic.
Note: these are cumulative iotop counters, not sustained rates. The actual average write speed shown by Cloudron's dashboard is ~2.5-4 MB/s, which still translates to 216-345 GB/day of unnecessary disk writes on a lightly loaded server.
-
There is a lot of information here, but I think it got all a bit too mixed together making it unclear what might actually case the disk I/O. For a start, upserting sessions in mysql does not mean it would sync to disk all the time, so this may or may not be related. Also it is unclear to me when and why how much disk I/O is expected and when it is an issue. So it becomes even harder to properly respond here.
Maybe we can try to separate the issues mainly first focusing on the potentially unnecessary session creation by the healtheck and that also ideally one application at a time. Maybe you can create those issues at the individual app packages to track those better, otherwise those issues easily get lost until such time we have resources to look into those.
-
 N nebulon forked this topic on
-
N nebulon forked this topic on
-
I imc67 referenced this topic on
-
Thanks @nebulon for dividing the main issue "high disk I/O" and my three possible root causes into 3.
Here we can focus on Matomo, current situation on 3 different servers, each with one Matomo app:
ysql> SELECT COUNT(*), MIN(FROM_UNIXTIME(modified)), MAX(FROM_UNIXTIME(modified))  FROM session;
+----------+------------------------------+------------------------------+
| COUNT(*) | MIN(FROM_UNIXTIME(modified)) | MAX(FROM_UNIXTIME(modified)) |
+----------+------------------------------+------------------------------+
|   121230 | 2026-02-24 21:02:50          | 2026-03-10 21:43:20          |
+----------+------------------------------+------------------------------+
1 row in set (0.13 sec)
mysql> SELECT COUNT(*), MIN(FROM_UNIXTIME(modified)), MAX(FROM_UNIXTIME(modified)) FROM session; +----------+------------------------------+------------------------------+ | COUNT(*) | MIN(FROM_UNIXTIME(modified)) | MAX(FROM_UNIXTIME(modified)) | +----------+------------------------------+------------------------------+ | 120811 | 2026-02-24 21:41:30 | 2026-03-10 21:43:10 | +----------+------------------------------+------------------------------+ 1 row in set (0.13 sec)mysql> SELECT COUNT(*), MIN(FROM_UNIXTIME(modified)), MAX(FROM_UNIXTIME(modified)) FROM session; +----------+------------------------------+------------------------------+ | COUNT(*) | MIN(FROM_UNIXTIME(modified)) | MAX(FROM_UNIXTIME(modified)) | +----------+------------------------------+------------------------------+ | 22494 | 2026-03-08 07:31:01 | 2026-03-10 21:40:00 | +----------+------------------------------+------------------------------+ 1 row in set (0.02 sec)This looks like a serious amount of sessions in a short time, to be exactly:
120.811 / 20.161,67 = 5,99 sessions per minuteis every 10 seconds health check.The only thing I can find in the config.ini.php regarding sessions is:
session_save_handler = ""and I don't remember me changing that? -
Here is a more complete analysis of the disk I/O across all 3 servers.
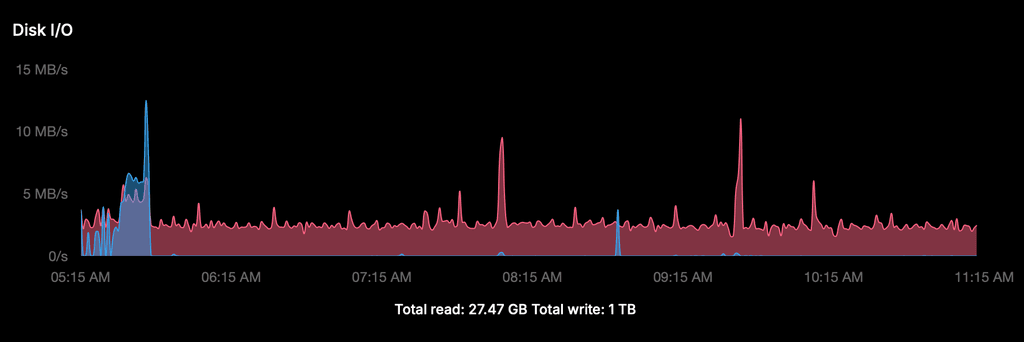
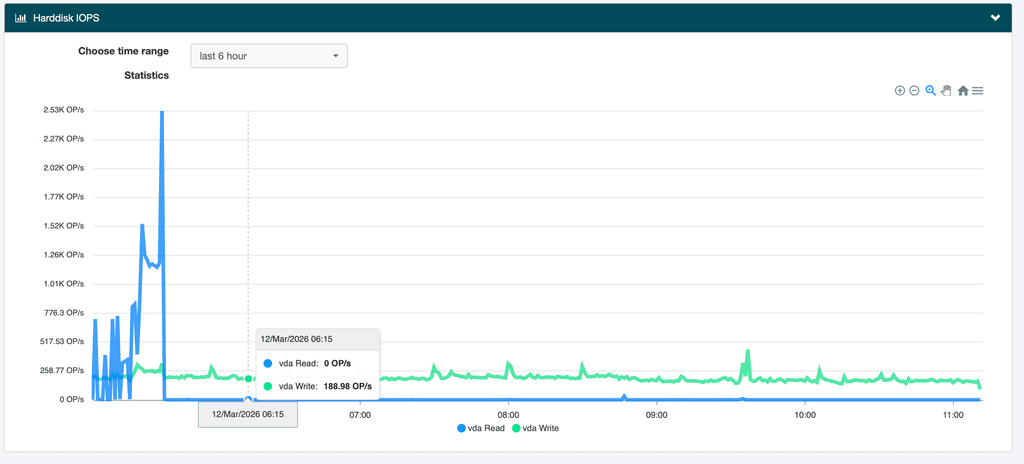
1. Cloudron Disk I/O graph (server 1, last 6 hours)
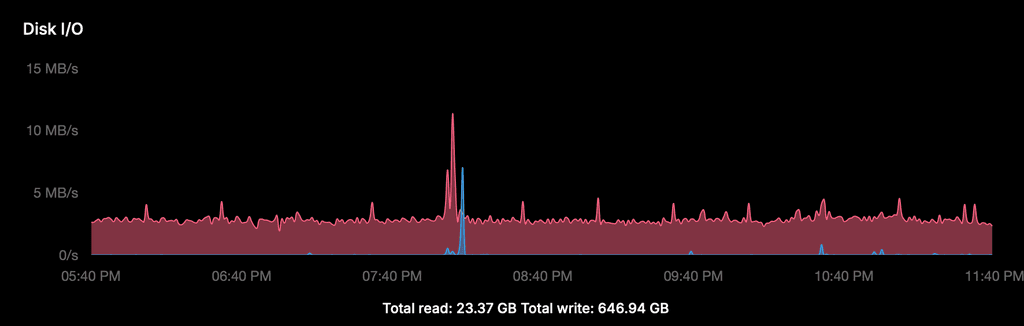
The graph shows a constant write baseline of ~2.5 MB/s, 24/7. The spike around 20:00 is the scheduled daily backup — completely normal. The total write of 646 GB over 2 days (~323 GB/day) is almost entirely this constant baseline, not user traffic or backups.
2. iotop breakdown (server 1, 1 minute measurement)
Docker MySQL (messageb):  48.62 MB/min  (~0.81 MB/s)
Host MySQL:               23.26 MB/min  (~0.39 MB/s)
go-carbon:                 9.34 MB/min  (~0.16 MB/s)
jbd2 (fs journal):         8.44 MB/min  (~0.14 MB/s)
systemd-journald:          4.37 MB/min  (~0.07 MB/s)
containerd:                2.02 MB/min  (~0.03 MB/s)
dockerd:                   1.13 MB/min  (~0.02 MB/s)
Total:                   ~97 MB/min    (~1.6 MB/s average)
Note: the average of ~1.6 MB/s is consistent with the graph baseline of ~2.5 MB/s when accounting for peaks and the fact that iotop measures a 1-minute window.
3. InnoDB write activity since last MySQL restart (all 3 servers)
Server 1 (uptime 59 min) Server 2 (uptime ~40h) Server 3 (uptime ~40h) Data written 2.13 GB 55.3 GB 63.5 GB Effective write rate ~0.58 MB/s ~0.38 MB/s ~0.43 MB/s Rows inserted/s 6.5 8.8 8.6 Rows updated/s 7.0 4.5 4.0 Log writes/s 28.7 23.6 18.0 All three servers show a consistent insert rate of ~6-9 rows/second in the Docker MySQL, matching exactly 1 new Matomo session every 10 seconds (= health check interval).
Conclusion
The Docker MySQL (~0.4-0.8 MB/s) is the largest single contributor, driven primarily by Matomo session inserts. The total observed disk I/O of 2-4 MB/s is the sum of multiple processes, with the constant Matomo session accumulation as the most significant and most easily fixable component.
-
J joseph forked this topic on
-
Summary of extensive disk I/O investigation — findings and conclusions
After spending considerable time investigating the high disk I/O on my servers (with help from an Claude PRO AI assistant, especially for this issue I subscribed to PRO!), I want to share my findings for anyone else experiencing this issue.
Setup: 3 servers running Cloudron v9.1.3, Ubuntu 22.04. Server 1 (just to focus on one): 12 WordPress sites, Matomo, EspoCRM, FreeScout (2x), Roundcube, MiroTalk, Taiga, MainWP, Yourls, Surfer (2x). Constant write I/O of ~2.5 MB/s = ~347 GB/day.
Reference: Cloudron demo server (20 apps including Nextcloud, Matrix, Discourse) shows ~80 GB/day. My servers run 4-5x higher with lighter apps.
What we investigated and measured
iotopanalysis: Docker MySQL (messageb) and host MySQL are by far the largest writers- MySQL general log analysis: mapped write distribution per table
- Tested
innodb_flush_log_at_trx_commit = 2: changes the pattern (bursts instead of constant pressure) but total write volume unchanged - Analyzed nginx access logs for suspicious traffic patterns
- Compared against Cloudron demo server
What was cleaned up (almost no impact)
- EspoCRM: deleted 244K jobs + 244K scheduled_job_log_records; set
cleanupJobPeriodto 7 days - WordPress actionscheduler_claims: deleted 130K rows
- Roundcube: reduced from 5 to 1 installation
- Matomo: adjusted
session_gc_probabilityandlogin_cookie_expire; cleared accumulated sessions - Wordfence: reduced live traffic table to 200 rows / 1 day, disabled audit logging
- MainWP: disabled uptime monitor addon and SSL monitor addon
- MainWP wp_mainwp_wp_logs: deleted 46,903 rows older than 30 days
- MainWP wp_mainwp_wp_logs_meta: deleted 141,682 orphaned records
- MainWP: disabled Network Activity logging
What was ruled out as significant I/O cause
- Matomo: stopped the app entirely → no measurable difference in I/O
- MainWP: one of the three servers has no MainWP but shows identical I/O pattern
- FreeScout: job tables are empty
- External scan traffic: all returning 404/301 from nginx, no database impact
What is proven but not fixable without Cloudron
- Matomo healthcheck bug:
GET /triggers the LoginOIDC plugin on every health check (every 10 seconds), creating a new MySQL session each time → 8,640 new sessions per day per Matomo instance. Fix requires changing the health check endpoint fromGET /to/matomo.jsin the app package. This is a Cloudron-side fix. Reported separately in topic 15211. - InnoDB configuration:
innodb_log_file_sizeis only 48MB (causes very frequent checkpoints),innodb_flush_methodis fsync. These settings are suboptimal for a write-heavy workload but are managed by Cloudron. - go-carbon/Graphite: writes ~0.13 MB/s continuously for 814 whisper metric files — inherent to Cloudron's monitoring stack.
Conclusion
There is no single large cause. The high I/O is the sum of multiple Cloudron-internal mechanisms. Everything works correctly — no performance issues, no user impact. But for a server with relatively low user traffic, 347 GB/day of writes feels disproportionate, especially compared to the Cloudron demo server at ~80 GB/day.
Sharing this in case it helps others investigating the same issue.
Great investigation, thanks for putting in the time and effort.
But for a server with relatively low user traffic, 347 GB/day of writes feels disproportionate, especially compared to the Cloudron demo server at ~80 GB/day.
I actually fixed some graph bugs yesterday here and here. Is that number 347GB coming from the Cloudron graph? If so, that value is actually showing the value since the server last rebooted! It has nothing to do with the window range selected. I also noticed that if you select ranges, you will see the value decrease. This was the bug I fixed.
@imc67 also, have you compared the i/o rate against your VPS provider graphs also? I wouldn't rule out a bug in cloudron graphs (we rewrote the metric system, so maybe there are bugs).
-
Great investigation, thanks for putting in the time and effort.
But for a server with relatively low user traffic, 347 GB/day of writes feels disproportionate, especially compared to the Cloudron demo server at ~80 GB/day.
I actually fixed some graph bugs yesterday here and here. Is that number 347GB coming from the Cloudron graph? If so, that value is actually showing the value since the server last rebooted! It has nothing to do with the window range selected. I also noticed that if you select ranges, you will see the value decrease. This was the bug I fixed.
@imc67 also, have you compared the i/o rate against your VPS provider graphs also? I wouldn't rule out a bug in cloudron graphs (we rewrote the metric system, so maybe there are bugs).
Hello! It looks like you're interested in this conversation, but you don't have an account yet.
Getting fed up of having to scroll through the same posts each visit? When you register for an account, you'll always come back to exactly where you were before, and choose to be notified of new replies (either via email, or push notification). You'll also be able to save bookmarks and upvote posts to show your appreciation to other community members.
With your input, this post could be even better 💗
Register Login