Seems like my server may be affected by the 9.1.7 update, lots of weird problems
-
At first I noticed my email not connecting. I tried one of my sites and it didn't load. I went to the dashboard and everything was suuppperr slow. I rebooted from the dashboard, and then ran
sudo cloudron-support --troubleshootand showed some services Failed. Mail wasn't running so I ran docker start mail, and that got it going, but still no apps, they were all Pending. I've rebooted at least 4 times now and most of the same things aren't working. I've just checked the Services in the daashboard and all the DBs, Mongo and FileManager are white or grey, and Redis are red. I've runsudo cloudron-support --troubleshootand this is what it shows:Vendor: QEMU Product: Standard PC (Q35 + ICH9, 2009) Linux: 5.15.0-177-generic Ubuntu: jammy 22.04 Cloudron: 9.1.7 Execution environment: kvm Processor: Intel(R) Xeon(R) CPU E5-2650 v4 @ 2.20GHz x 12 RAM: 49327400KB Disk: /dev/sda2 392G [OK] node version is correct [OK] IPv6 is enabled and public IPv6 address is working [OK] docker is running [OK] docker version is correct [OK] MySQL is running [OK] netplan is good [OK] DNS is resolving via systemd-resolved [OK] unbound is running [OK] nginx is running [OK] dashboard cert is valid [OK] dashboard is reachable via loopback [OK] No pending database migrations [WARN] Service 'mysql' is not running (may be lazy-stopped) [WARN] Service 'postgresql' is not running (may be lazy-stopped) [WARN] Service 'mongodb' is not running (may be lazy-stopped) [OK] Service 'mail' is running and healthy [FAIL] Service 'graphite' container is not running (state: exited)! [FAIL] Service 'sftp' container is not running (state: exited)! [OK] box v9.1.7 is running [OK] Dashboard is reachable via domain name [OK] Domain toutdo.com is valid and has not expiredPressing Restart on those Services in teh Dashboard has gotten most of them running except Redis, MongoDB and MySQL. The logs for Cloudron Service say all the apps are
waiting for 448.684 to update health. Not one app is running this time either whereas after earlier restarts some of them did.Help!
-
I've seen a few more apps start up on their own, seemingly. And I've been able to manually start some other apps using either the Restart button on the app in the dashboard, or on the cli using
sudo docker run -it cloudron/com.libretranslate.cloudronapp:xxxxxxxxxxxxxx, but that last cli approach only works if I can see which images are running usingsudo docker psso if an app is stalled and not running I can't start it from the cli.sudo cloudron-support --troubleshoottells me everything is fine except
[WARN] Service 'mongodb' is not running (may be lazy-stopped).2026-05-11T02:25:57.731Z apphealthmonitor: app health: 34 running / 11 stopped / 28 unresponsiveis the result fromsudo tail -f /home/yellowtent/platformdata/logs/box.log. What is going on?? -
So what is the current situation? Are all services up besides mongodb (which may be fine, since very few apps depend on that)?
Since you mentioned that everything was very slow, possibly things were busy (re)starting up.
Also since at least in the initial post,
graphiteandsftpservices were not up, apps will also not start up by the Cloudron platform as it has reached a healthy state yet. Is this still the case?If not, what errors are shown in the app itself if you restart one of the app which are down?
-
Some apps are running. When I click on some labelled "Not Responding" its dashboard won't load, I can see in the logs
May 11 09:08:09 shell: df: df -B1 --output=source,fstype,size,used,avail,pcent,target /home/yellowtent/appsdata/66c962bb-24fa-4237-9166-459875c74e1b/datafor that app. Then when I click back, the main dashboard won't load! This longer bit seemed to happen too when I tried to click to the unresponsive app's dashboard:ay 11 09:07:50 apphealthmonitor: app health: 36 running / 11 stopped / 26 unresponsive May 11 09:07:50 shell: df: df -B1 --output=source,fstype,size,used,avail,pcent,target /home/yellowtent/appsdata/03233c73-df43-43ec-82ba-0518542ea09a/data May 11 09:07:51 apphealthmonitor: app health: 36 running / 11 stopped / 26 unresponsive May 11 09:07:51 shell: df: df -B1 --output=source,fstype,size,used,avail,pcent,target /home/yellowtent/appsdata/040b01cf-5c14-4db5-ba54-83f3356cb466/data May 11 09:07:52 shell: df: df -B1 --output=source,fstype,size,used,avail,pcent,target /home/yellowtent/appsdata/05460bf6-5d11-4b75-b467-8725d7c07113/data May 11 09:07:54 shell: df: df -B1 --output=source,fstype,size,used,avail,pcent,target /home/yellowtent/appsdata/05b7c6ea-7452-4505-8345-46903fa89f1f/data May 11 09:07:58 shell: df: df -B1 --output=source,fstype,size,used,avail,pcent,target /home/yellowtent/appsdata/09c4a0ac-8f68-4d66-9466-634fed6b8e79/data May 11 09:07:58 { May 11 09:07:58 path: '/api/v1/system/filesystems', May 11 09:07:58 status: 500, May 11 09:07:58 error: ServerError [ServiceUnavailableError]: Response timeout May 11 09:07:58 at IncomingMessage.<anonymous> (/home/yellowtent/box/node_modules/connect-timeout/index.js:84:8) May 11 09:07:58 at IncomingMessage.emit (node:events:508:28) May 11 09:07:58 at Timeout._onTimeout (/home/yellowtent/box/node_modules/connect-timeout/index.js:49:11) May 11 09:07:58 at listOnTimeout (node:internal/timers:605:17) May 11 09:07:58 at process.processTimers (node:internal/timers:541:7) { May 11 09:07:58 code: 'ETIMEDOUT', May 11 09:07:58 timeout: 60000 May 11 09:07:58 } May 11 09:07:58 } May 11 09:07:59 shell: df: df -B1 --output=source,fstype,size,used,avail,pcent,target /home/yellowtent/appsdata/0daa5ebf-8507-4cdd-a657-01f41c0068fc/data May 11 09:07:59 shell: df: df -B1 --output=source,fstype,size,used,avail,pcent,target /home/yellowtent/appsdata/113cef81-b36d-45ec-9158-82cf1309db37/data May 11 09:08:00 apphealIs there something wrong with my disk?
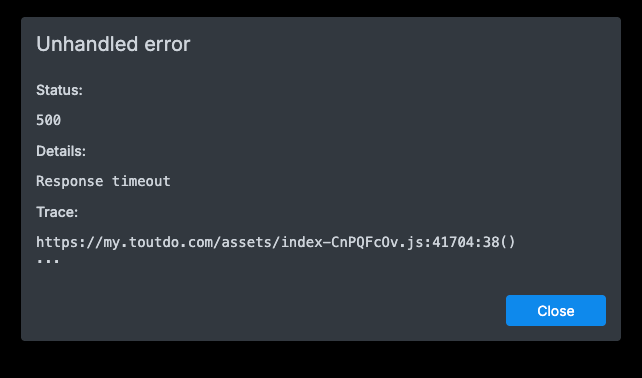
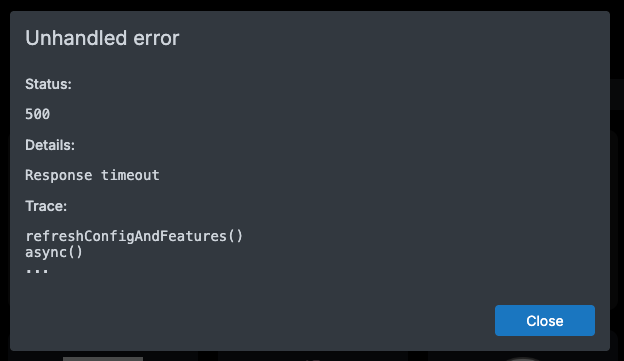
Last night while troubleshooting the dashboard wouldn't load and I'd get these:A life lived in fear is a life half-lived
-
Some apps are running. When I click on some labelled "Not Responding" its dashboard won't load, I can see in the logs
May 11 09:08:09 shell: df: df -B1 --output=source,fstype,size,used,avail,pcent,target /home/yellowtent/appsdata/66c962bb-24fa-4237-9166-459875c74e1b/datafor that app. Then when I click back, the main dashboard won't load! This longer bit seemed to happen too when I tried to click to the unresponsive app's dashboard:ay 11 09:07:50 apphealthmonitor: app health: 36 running / 11 stopped / 26 unresponsive May 11 09:07:50 shell: df: df -B1 --output=source,fstype,size,used,avail,pcent,target /home/yellowtent/appsdata/03233c73-df43-43ec-82ba-0518542ea09a/data May 11 09:07:51 apphealthmonitor: app health: 36 running / 11 stopped / 26 unresponsive May 11 09:07:51 shell: df: df -B1 --output=source,fstype,size,used,avail,pcent,target /home/yellowtent/appsdata/040b01cf-5c14-4db5-ba54-83f3356cb466/data May 11 09:07:52 shell: df: df -B1 --output=source,fstype,size,used,avail,pcent,target /home/yellowtent/appsdata/05460bf6-5d11-4b75-b467-8725d7c07113/data May 11 09:07:54 shell: df: df -B1 --output=source,fstype,size,used,avail,pcent,target /home/yellowtent/appsdata/05b7c6ea-7452-4505-8345-46903fa89f1f/data May 11 09:07:58 shell: df: df -B1 --output=source,fstype,size,used,avail,pcent,target /home/yellowtent/appsdata/09c4a0ac-8f68-4d66-9466-634fed6b8e79/data May 11 09:07:58 { May 11 09:07:58 path: '/api/v1/system/filesystems', May 11 09:07:58 status: 500, May 11 09:07:58 error: ServerError [ServiceUnavailableError]: Response timeout May 11 09:07:58 at IncomingMessage.<anonymous> (/home/yellowtent/box/node_modules/connect-timeout/index.js:84:8) May 11 09:07:58 at IncomingMessage.emit (node:events:508:28) May 11 09:07:58 at Timeout._onTimeout (/home/yellowtent/box/node_modules/connect-timeout/index.js:49:11) May 11 09:07:58 at listOnTimeout (node:internal/timers:605:17) May 11 09:07:58 at process.processTimers (node:internal/timers:541:7) { May 11 09:07:58 code: 'ETIMEDOUT', May 11 09:07:58 timeout: 60000 May 11 09:07:58 } May 11 09:07:58 } May 11 09:07:59 shell: df: df -B1 --output=source,fstype,size,used,avail,pcent,target /home/yellowtent/appsdata/0daa5ebf-8507-4cdd-a657-01f41c0068fc/data May 11 09:07:59 shell: df: df -B1 --output=source,fstype,size,used,avail,pcent,target /home/yellowtent/appsdata/113cef81-b36d-45ec-9158-82cf1309db37/data May 11 09:08:00 apphealIs there something wrong with my disk?
Last night while troubleshooting the dashboard wouldn't load and I'd get these: -
receiving response timeout from the backend usually means the box process is too slow to respond, which in turn may hint at a system overload. But since one is also failing when querying the fileystem routes, maybe you have a locked up filessytem mounted which makes the system hang?
Does a normal
df -hvia SSH work fine and are all mountpoints healthy? -
Seems like it. I have lots of the below:
overlay                                    709G  281G  392G  42% /var/lib/docker/overlay2/42dc09e1ab2f10ed432cae69adfe96136fd88c3a605b4bc39f823c05cc53b679/merged
overlay                                    709G  281G  392G  42% /var/lib/docker/overlay2/3ac8dfcbe628dcdf82236861f36b799f4392830bad9203669741cb2d9f1a0767/merged
overlay                                    709G  281G  392G  42% /var/lib/docker/overlay2/74626746866ed86941b6e48831acf5f38a2feaa8297c3c4ad6851d4ec591c169/merged
overlay                                    709G  281G  392G  42% /var/lib/docker/overlay2/1c7f0e1688f8c536f6d6081af1f98b8ba7033658f32a173e0eed1f41d62ae847/merged
tmpfs                                      4.8G  4.0K  4.8G   1% /run/user/1000
overlay                                    709G  281G  392G  42% /var/lib/docker/overlay2/4a208722f4e76888c9ff9b9a9a69c1180f28458b075b8bdbc2a81f17029acbeb/merged
overlay                                    709G  281G  392G  42% /var/lib/docker/overlay2/091f8c6db63e863e5046a8ab27351f49f6eef980cadda12dd5d4e06acbbfa491/merged
overlay                                    709G  281G  392G  42% /var/lib/docker/overlay2/358bb3005eb75b4de6a19ac978ca6e9acffaf301e587c3c65278c383ca6588a8/merged
I do have two remote mountpoints which seem fine, but one is at 95%.
-
I tried one app which was Not Responding, a github pages app, and it eventually started. I tried another, Syncthing, and it failed:
y 11 09:55:09 taskworker: Starting task 26861. Logs are at /home/yellowtent/platformdata/logs/d1047eec-0fb9-4f77-9e9a-befd6280935d/apptask.log May 11 09:55:11 taskworker: Running task of type app May 11 09:55:12 apptask: run: startTask installationState: pending_restart runState: running May 11 09:55:12 tasks: updating task 26861 with: {"percent":10,"message":"Starting app services"} May 11 09:55:12 tasks: updating task 26861 with: {"percent":30,"message":"Restarting container"} May 11 09:55:28 tasks: updating task 26861 with: {"percent":70,"message":"Configuring reverse proxy"} May 11 09:55:28 shell: openssl: openssl x509 -noout -subject -issuer May 11 09:55:29 reverseproxy: providerMatches: subject=CN = sync.example.com domain=sync.example.com issuer=C = US, O = Let's Encrypt, CN = E8 wildcard=false/false prod=true/true issuerMismatch=false wildcardMismatch=false match=true May 11 09:55:29 shell: openssl: openssl x509 -startdate -enddate -subject -noout May 11 09:55:29 openssl: expiryDate: subject=CN = sync.example.com notBefore=May 2 08:28:20 2026 GMT notAfter=Jul 31 08:28:19 2026 GMT daysLeft=80.77279122685185 May 11 09:55:29 reverseproxy: ensureCertificate: sync.example.com acme cert exists and is up to date May 11 09:55:29 reverseproxy: needsRenewal: false. ARI {"start":"Tue, 30 Jun 2026 11:12:24 GMT","end":"Thu, 02 Jul 2026 06:23:14 GMT","rt":"Wed, 01 Jul 2026 19:28:54 GMT","valid":"Mon, 11 May 2026 16:35:58 GMT","url":"https://acme-v02.api.letsencrypt.org/acme/renewal-info","ts":"Mon, 11 May 2026 09:28:27 GMT"} May 11 09:55:30 reverseproxy: writeAppLocationNginxConfig: writing config for "sync.example.com" to /home/yellowtent/platformdata/nginx/applications/d1047eec-0fb9-4f77-9e9a-befd6280935d/sync.example.com.conf with options {"sourceDir":"/home/yellowtent/box","vhost":"sync.example.com","hasIPv6":true,"ip":"172.18.18.120","port":8000,"endpoint":"app","redirectTo":null,"certFilePath":"/home/yellowtent/platformdata/nginx/cert/sync.example.com.cert","keyFilePath":"/home/yellowtent/platformdata/nginx/cert/sync.example.com.key","robotsTxtQuoted":null,"cspQuoted":null,"hideHeaders":[],"proxyAuth":{"enabled":false,"id":"d1047eec-0fb9-4f77-9e9a-befd6280935d","location":"/"},"upstreamUri":"","hstsPreload":false} May 11 09:55:30 shell: reverseproxy: /usr/bin/sudo --non-interactive /home/yellowtent/box/src/scripts/restartservice.sh nginx May 11 09:55:39 tasks: updating task 26861 with: {"percent":100,"message":"Done"} May 11 09:55:41 tasks: setCompleted - 26861: {"result":null,"error":null,"percent":100} May 11 09:55:41 tasks: updating task 26861 with: {"completed":true,"result":null,"error":null,"percent":100} May 11 09:55:41 taskworker: Task took 32.599 seconds May 11 09:55:41 Exiting with code 0 May 11 09:55:47 => Healthcheck error: Error: connect ECONNREFUSED 172.18.18.120:8000 May 11 09:55:58 => Healthcheck error: Error: connect ECONNREFUSED 172.18.18.120:8000 -
That last log reads like things have worked out but it is still waiting for the healthcheck to succeed, the actual task exited fine with status code 0.
Not sure now what we should look at and what the issue is? Is the system overall showing high load or so?
-
Running
ps aux --sort=-%mem | headshows me thatyellowt+ 115187 65.5 0.6 10317968 328268 ? Ssl 02:48 479:12 node /home/yellowtent/box/box.jsis using 65.5% of the CPU... is that normal?
I also checked for CPU usage:shane@my:~$ ps aux --sort=-%cpu | head USER PID %CPU %MEM VSZ RSS TTY STAT START TIME COMMAND www-data 458271 74.2 0.2 225084 131340 ? R 15:07 0:20 php /app/pkg/wp --path=/app/data/public/ cron event run --due-now yellowt+ 115187 65.6 0.6 10323796 334180 ? Rsl 02:48 485:34 node /home/yellowtent/box/box.js shane 457394 64.8 2.4 2466264 1207968 pts/0 Rl 15:05 1:34 [celeryd: celery@b7c9aacf-af6b-4def-9981-7f24a752ed7c:ForkPoolWorker-112] root 922 33.1 0.2 8575356 128632 ? Ssl May10 312:52 /usr/bin/dockerd -H fd:// --log-driver=journald --exec-opt native.cgroupdriver=cgroupfs --storage-driver=overlay2 --experimental --ip6tables --userland-proxy=false message+ 458377 33.0 0.0 1304600 21680 ? Ss 15:07 0:00 postgres: user29397f7ab06c47eb898f8db21d530154 db29397f7ab06c47eb898f8db21d530154 fd00:c107:d509::1(54210) idle shane 46768 31.4 0.5 22570552 256684 pts/0 Rl 00:11 281:31 node current/index.js mysql 908 30.4 0.6 3079376 336300 ? Ssl May10 287:19 /usr/sbin/mysqld message+ 27167 24.8 1.2 5731612 594168 ? Sl May10 231:05 /usr/sbin/mysqld shane 29722 15.6 0.4 22525668 206996 pts/0 Sl May10 145:30 node current/index.js -
If it is normal or not, kinda depends on what the app does and how much traffic it sees, so maybe you have some idea from the past experience on that server?
So to come back to the original issue, the main thing is, that some dashboard routes are timing out, causing 500 status codes on requests still?
-
yeah so I guess the server struggles to respond in time (there is a time cap of 30s to respond to the dashboard). So the apps are still installed, but the dashboard failed to probably load them. Not sure how to debug this, is it possible that the box service just keeps restarting?
is
systemctl status boxshowing some decent uptime of that process and if not, if you keep trailing the logstail -f /home/yellowtent/platformdata/logs/box.logdoes it show frequent restarts?Also is anything unusual happening in say
journalctl --system -f? -
Well, I made a ticket at the host (SSDNodes) and they responded saying they "made some node-level tweaks", and now the server is back to its flying speed. I couched it in terms of any relation to two recent kernel local-privilege-escalation bugs (Copy Fail, CVE-2026-31431; Dirty Frag, CVE-2026-43284 plus CVE-2026-43500), but they didn't specify what they did. But, it is back to nice and very fast.
-
J joseph has marked this topic as solved on
")
Hello! It looks like you're interested in this conversation, but you don't have an account yet.
Getting fed up of having to scroll through the same posts each visit? When you register for an account, you'll always come back to exactly where you were before, and choose to be notified of new replies (either via email, or push notification). You'll also be able to save bookmarks and upvote posts to show your appreciation to other community members.
With your input, this post could be even better 💗
Register Login