CPU hogs are not ordered in graph. Hoping they can be sorted in next release.
-
Hello!
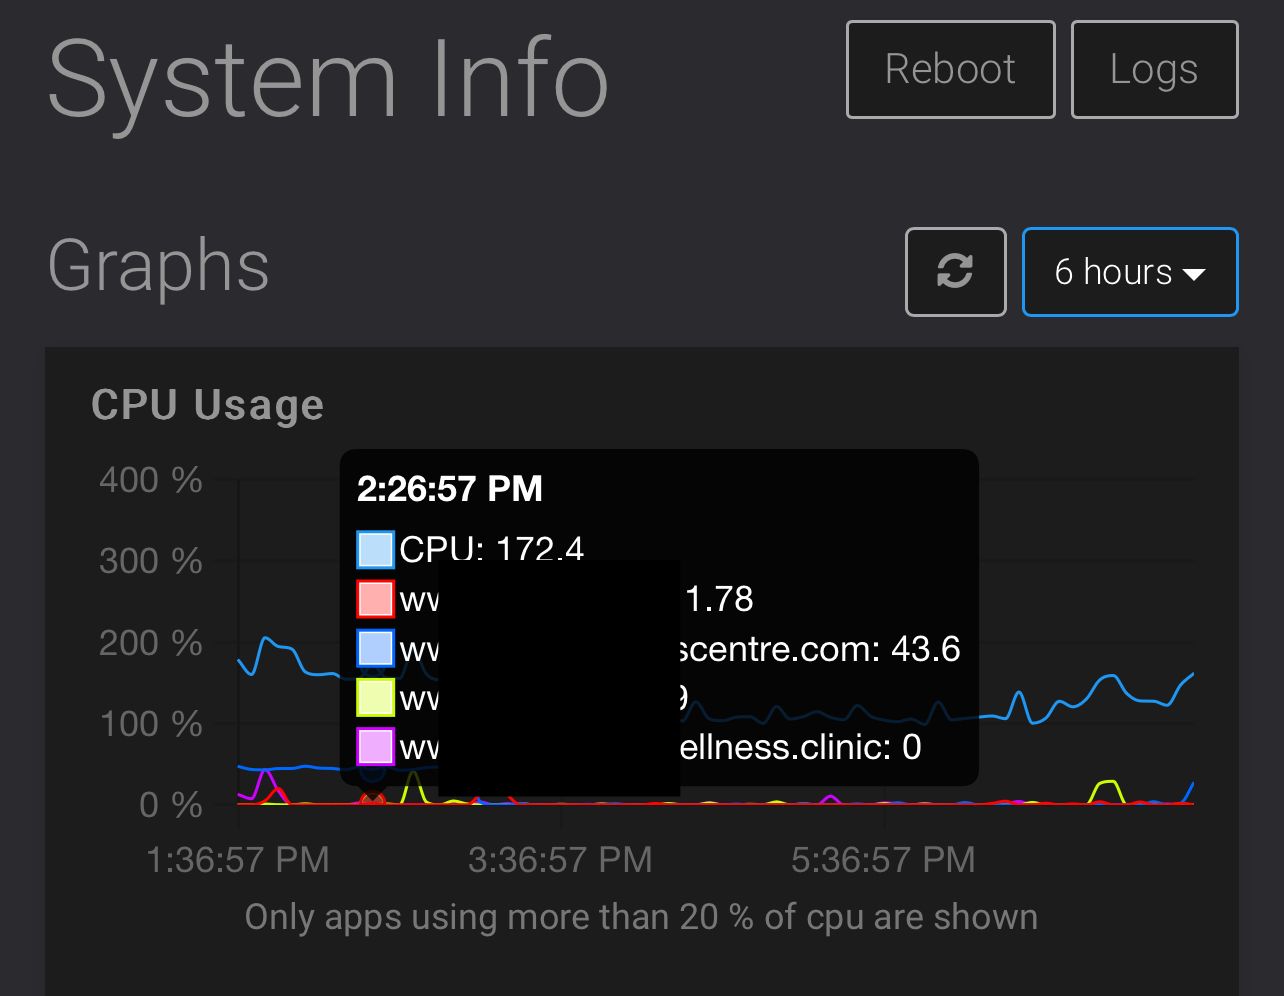
") Hope everyone is well. I realized with the new graphs in 7.3 that the CPU hogs aren’t showing quite right. I’d expect them to be sorted by overall at top then by descending order. However I notice that’s not often the case. Screenshot included.
Hope everyone is well. I realized with the new graphs in 7.3 that the CPU hogs aren’t showing quite right. I’d expect them to be sorted by overall at top then by descending order. However I notice that’s not often the case. Screenshot included.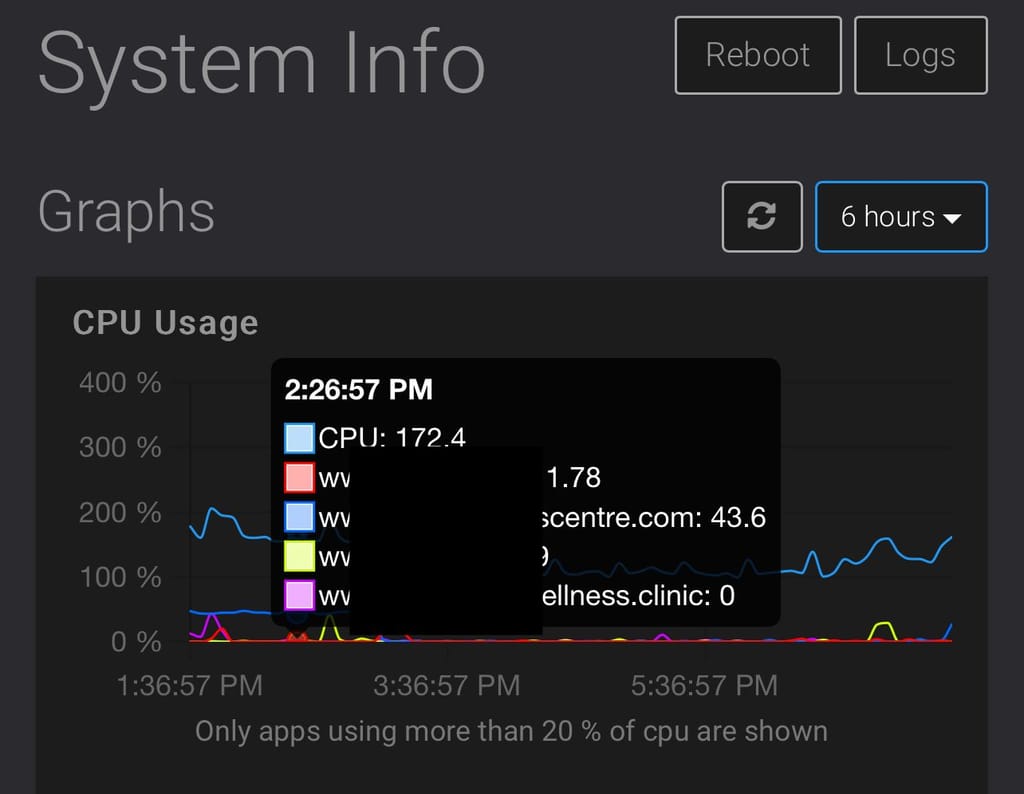
In my example above, the one ending in centre.com is 43.6% but it’s below the one that’s only 1.78%.
Slightly related, I noticed it has text beneath it showing that only apps using 20% or more CPU will be shown; but that also isn’t my experience so far as you can tell in the screenshot where there are ones showing with 0 usage still showing.
This seems a bit buggy to me so far, not sure if that’s fixed already in the next update to 7.3.x but hoping this can be addressed soon as I rely on these graphs from time to time and am finding it a bit hard to trust them (especially the disk stuff I had another post on but that was thankfully already addressed in the next update I read which is fantastic).
Thank you!
-
Currently the strategy is to show apps which use above 20% cpu as peak within the selected time-frame. So if an app has around 0% for most of the time with one peak above 20% then it will be included and shown for the entire selected duration, to not leave holes in the graph.
For the sorting, I am not sure what is expected. Should the apps be sorted by peak or average cpu usage there?
@nebulon For the sorting, I’m thinking it should be ordered by whatever is highest as shown in the graph. For example when I look at the screenshot the second highest blue line was for the larger CPU usage app but yet it’s third in the list there rather than second. Just seems strange and unexpected.
I think most users would naturally expect those to be sorted highest to lowest generally speaking although if it’s to simply stay consistent across the entire graph (for dragging the mouse over it) then I guess that may be more difficult to implement and thats understandable in that it may not be worth the effort to have it auto sort at any given time point.
--
Dustin Dauncey
www.d19.ca -
@nebulon For the sorting, I’m thinking it should be ordered by whatever is highest as shown in the graph. For example when I look at the screenshot the second highest blue line was for the larger CPU usage app but yet it’s third in the list there rather than second. Just seems strange and unexpected.
I think most users would naturally expect those to be sorted highest to lowest generally speaking although if it’s to simply stay consistent across the entire graph (for dragging the mouse over it) then I guess that may be more difficult to implement and thats understandable in that it may not be worth the effort to have it auto sort at any given time point.
@d19dotca to be honest, I think can be quite debatable, for example say three apps shape a rough sine curve across the time period, there would not be an easy visual winner. But what is also important here, currently we use what the graph library gives us and reworking this for little value is currently not worth while
Hello! It looks like you're interested in this conversation, but you don't have an account yet.
Getting fed up of having to scroll through the same posts each visit? When you register for an account, you'll always come back to exactly where you were before, and choose to be notified of new replies (either via email, or push notification). You'll also be able to save bookmarks and upvote posts to show your appreciation to other community members.
With your input, this post could be even better 💗
Register Login