CPU usage graph on System Info page, show 20% of whole system CPU instead of single-core CPU?
-
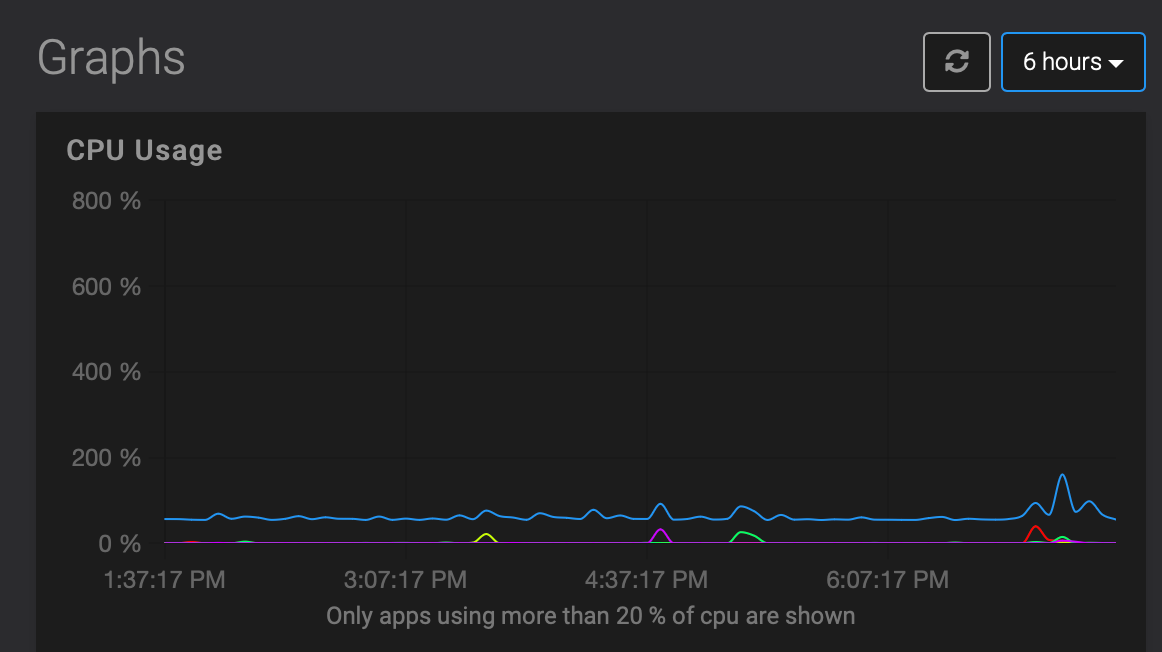
I'm curious... I have 8 CPU cores on my dedicated server at OVH and my graphs commonly look like the image below.
I'm thinking that the graph would be much more helpful if it was the arbitrary 20% of full system CPU rather than just 20% of one CPU core. Because 20% of just one CPU core in an 8-core system (or even a 4-core system) is hardly anything to be concerned about, generally speaking of course.
Would anyone else like to see this perhaps be 20% of full system CPU instead of just 20% of a single core?
--
Dustin Dauncey
www.d19.ca -
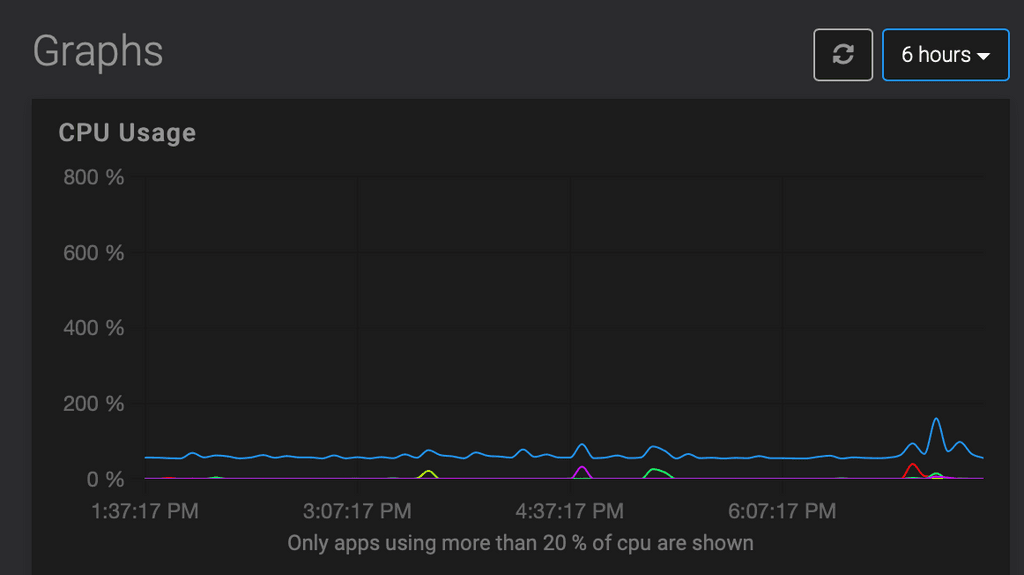
I'm curious... I have 8 CPU cores on my dedicated server at OVH and my graphs commonly look like the image below.
I'm thinking that the graph would be much more helpful if it was the arbitrary 20% of full system CPU rather than just 20% of one CPU core. Because 20% of just one CPU core in an 8-core system (or even a 4-core system) is hardly anything to be concerned about, generally speaking of course.
Would anyone else like to see this perhaps be 20% of full system CPU instead of just 20% of a single core?
@d19dotca For me, it's odd that they currently pick one app and say it's using 20% CPU, even when it's not. The rest are not even visible, even thought they do, for short periods of time.
I'd rather see the spikiness of some apps than a not so useful wash of ~20% supposedly being used by openvpn.
-
I think this was mentioned before somewhere, the graph shows apps which at any point in time for the currently selected time period, have been above 20% cpu usage.
Generally this graph example just shows that the system is fine, not sure why it causes concern.
-
I think this was mentioned before somewhere, the graph shows apps which at any point in time for the currently selected time period, have been above 20% cpu usage.
Generally this graph example just shows that the system is fine, not sure why it causes concern.
@nebulon oh it’s definitely not concerning to me at all. It’s just an area where I think it can be improved. To me 20% of a single core is very different than 20% of the system CPU.
Seeing most of the apps at basically 0% except for the odd spike of above 20% of a single core on an 8-core system just seems like noise to me.
I’d have thought it’d just be ideal if it was graphed as 20% of the system CPU instead of a single core CPU for which apps make the cut into the graph.
Maybe I’m all alone on that view though

-
 R robi referenced this topic on
Hello! It looks like you're interested in this conversation, but you don't have an account yet.
Getting fed up of having to scroll through the same posts each visit? When you register for an account, you'll always come back to exactly where you were before, and choose to be notified of new replies (either via email, or push notification). You'll also be able to save bookmarks and upvote posts to show your appreciation to other community members.
With your input, this post could be even better 💗
Register Login