Apache Echarts - Data Visualization
-
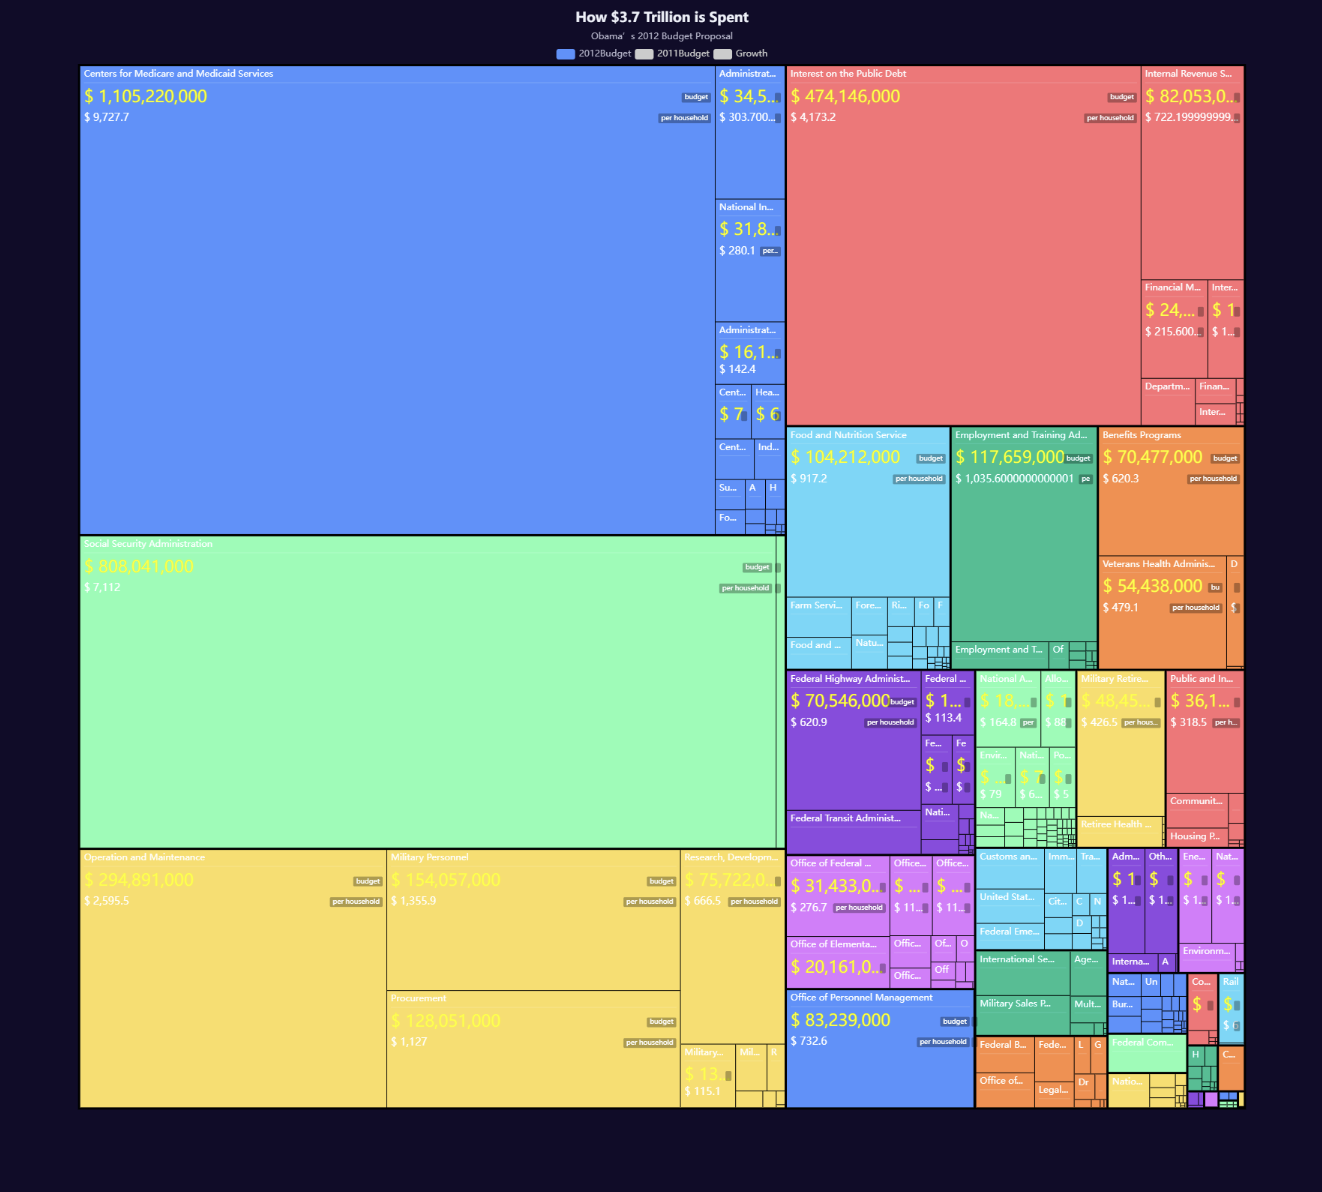
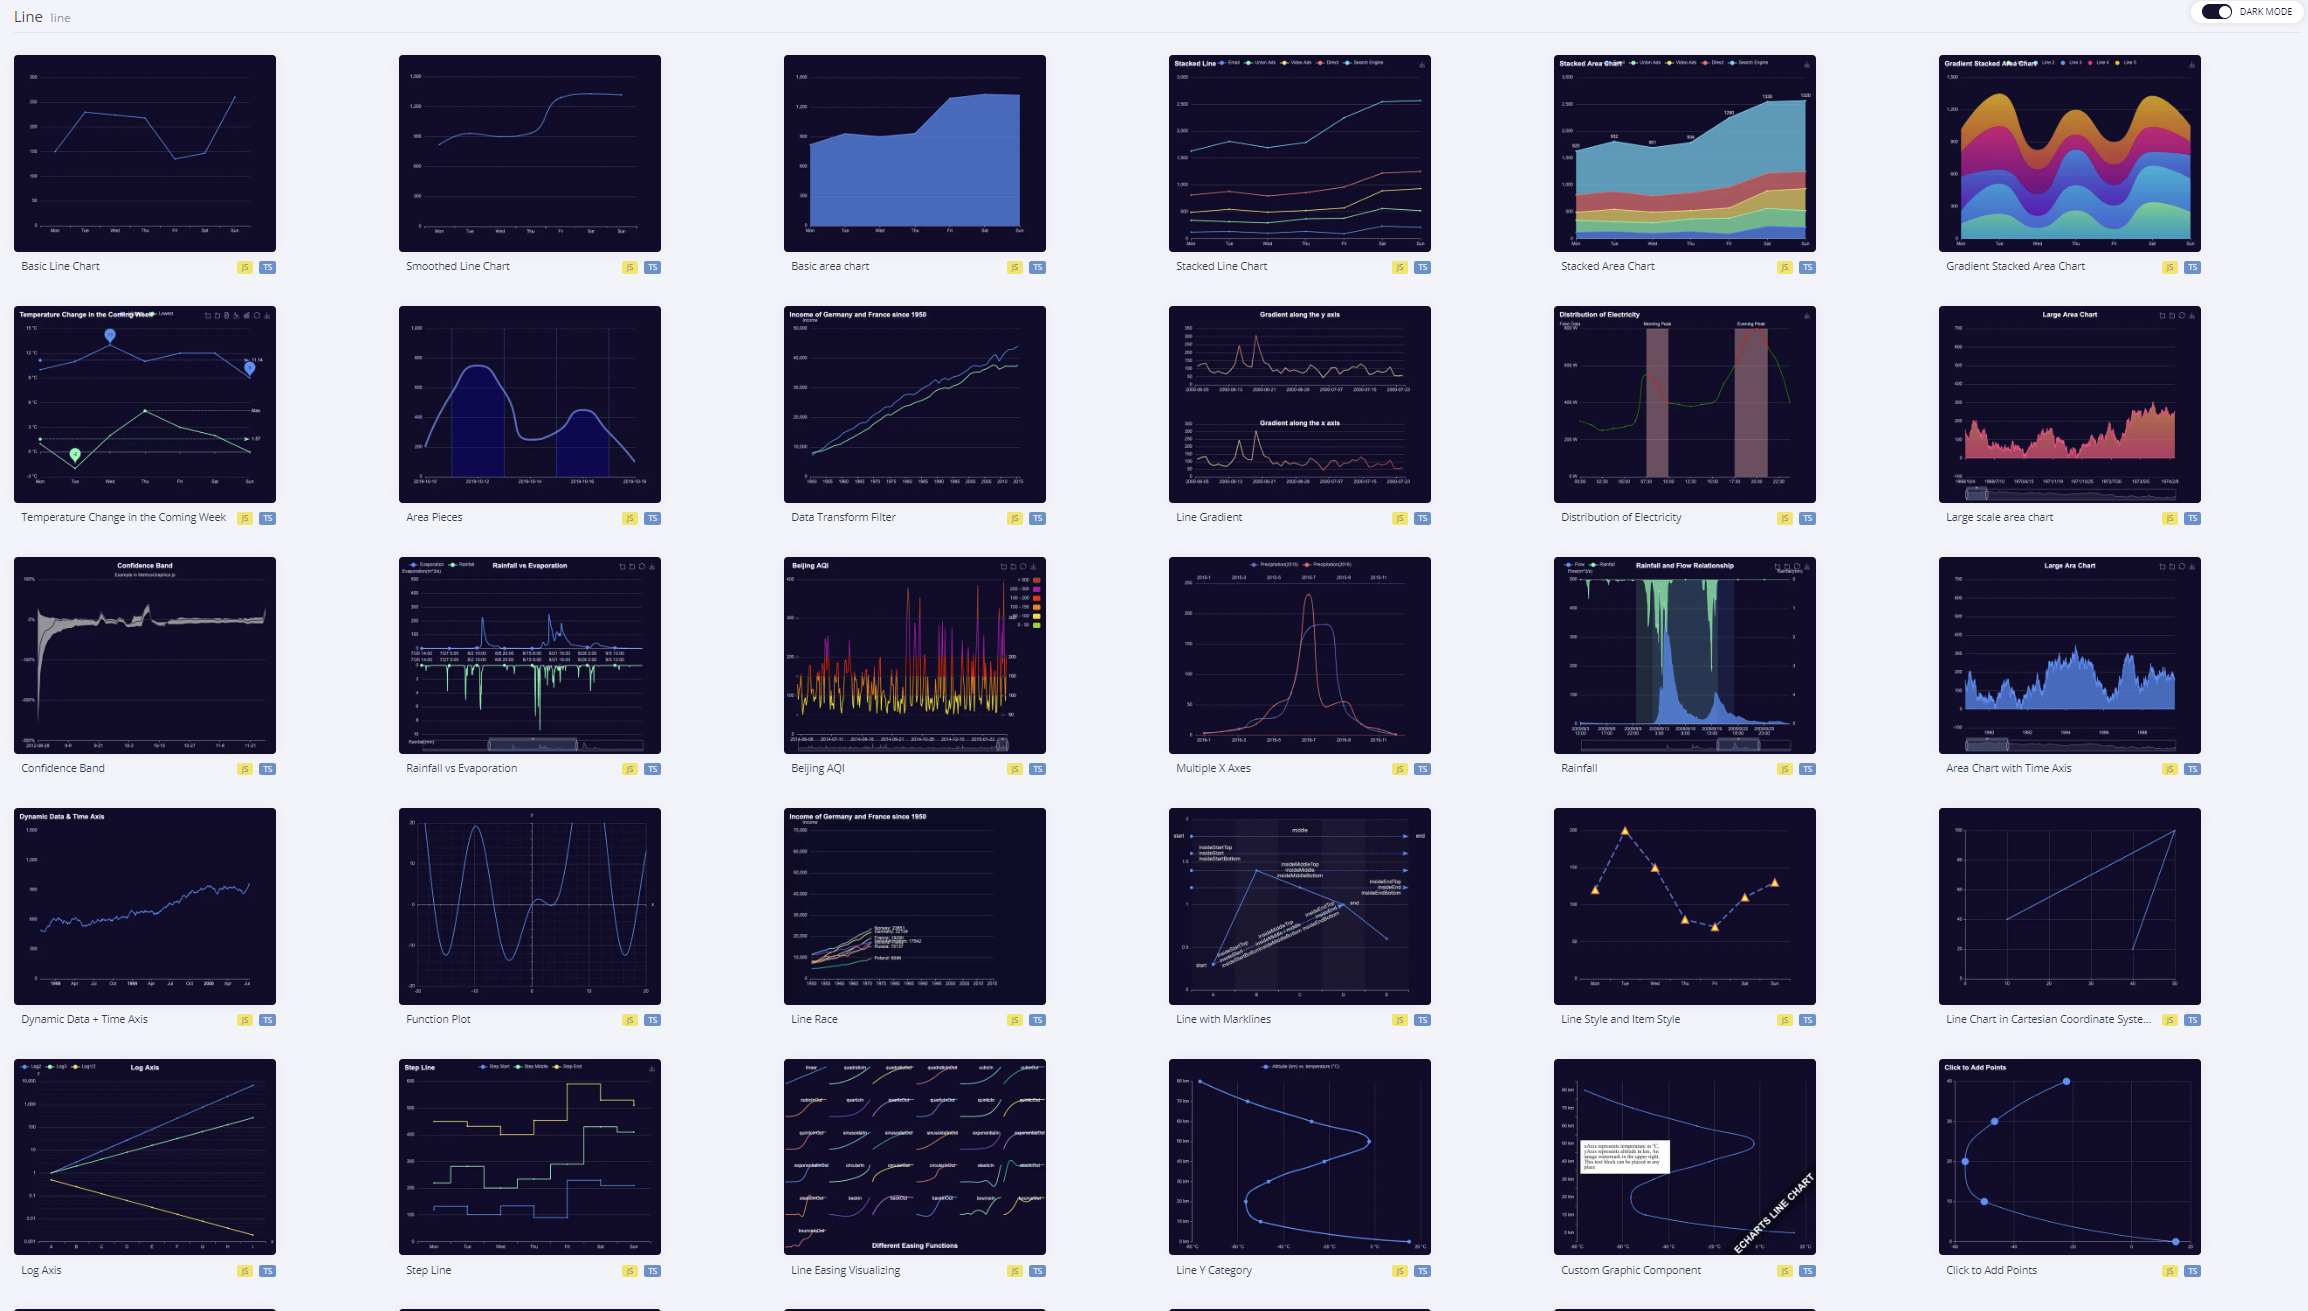
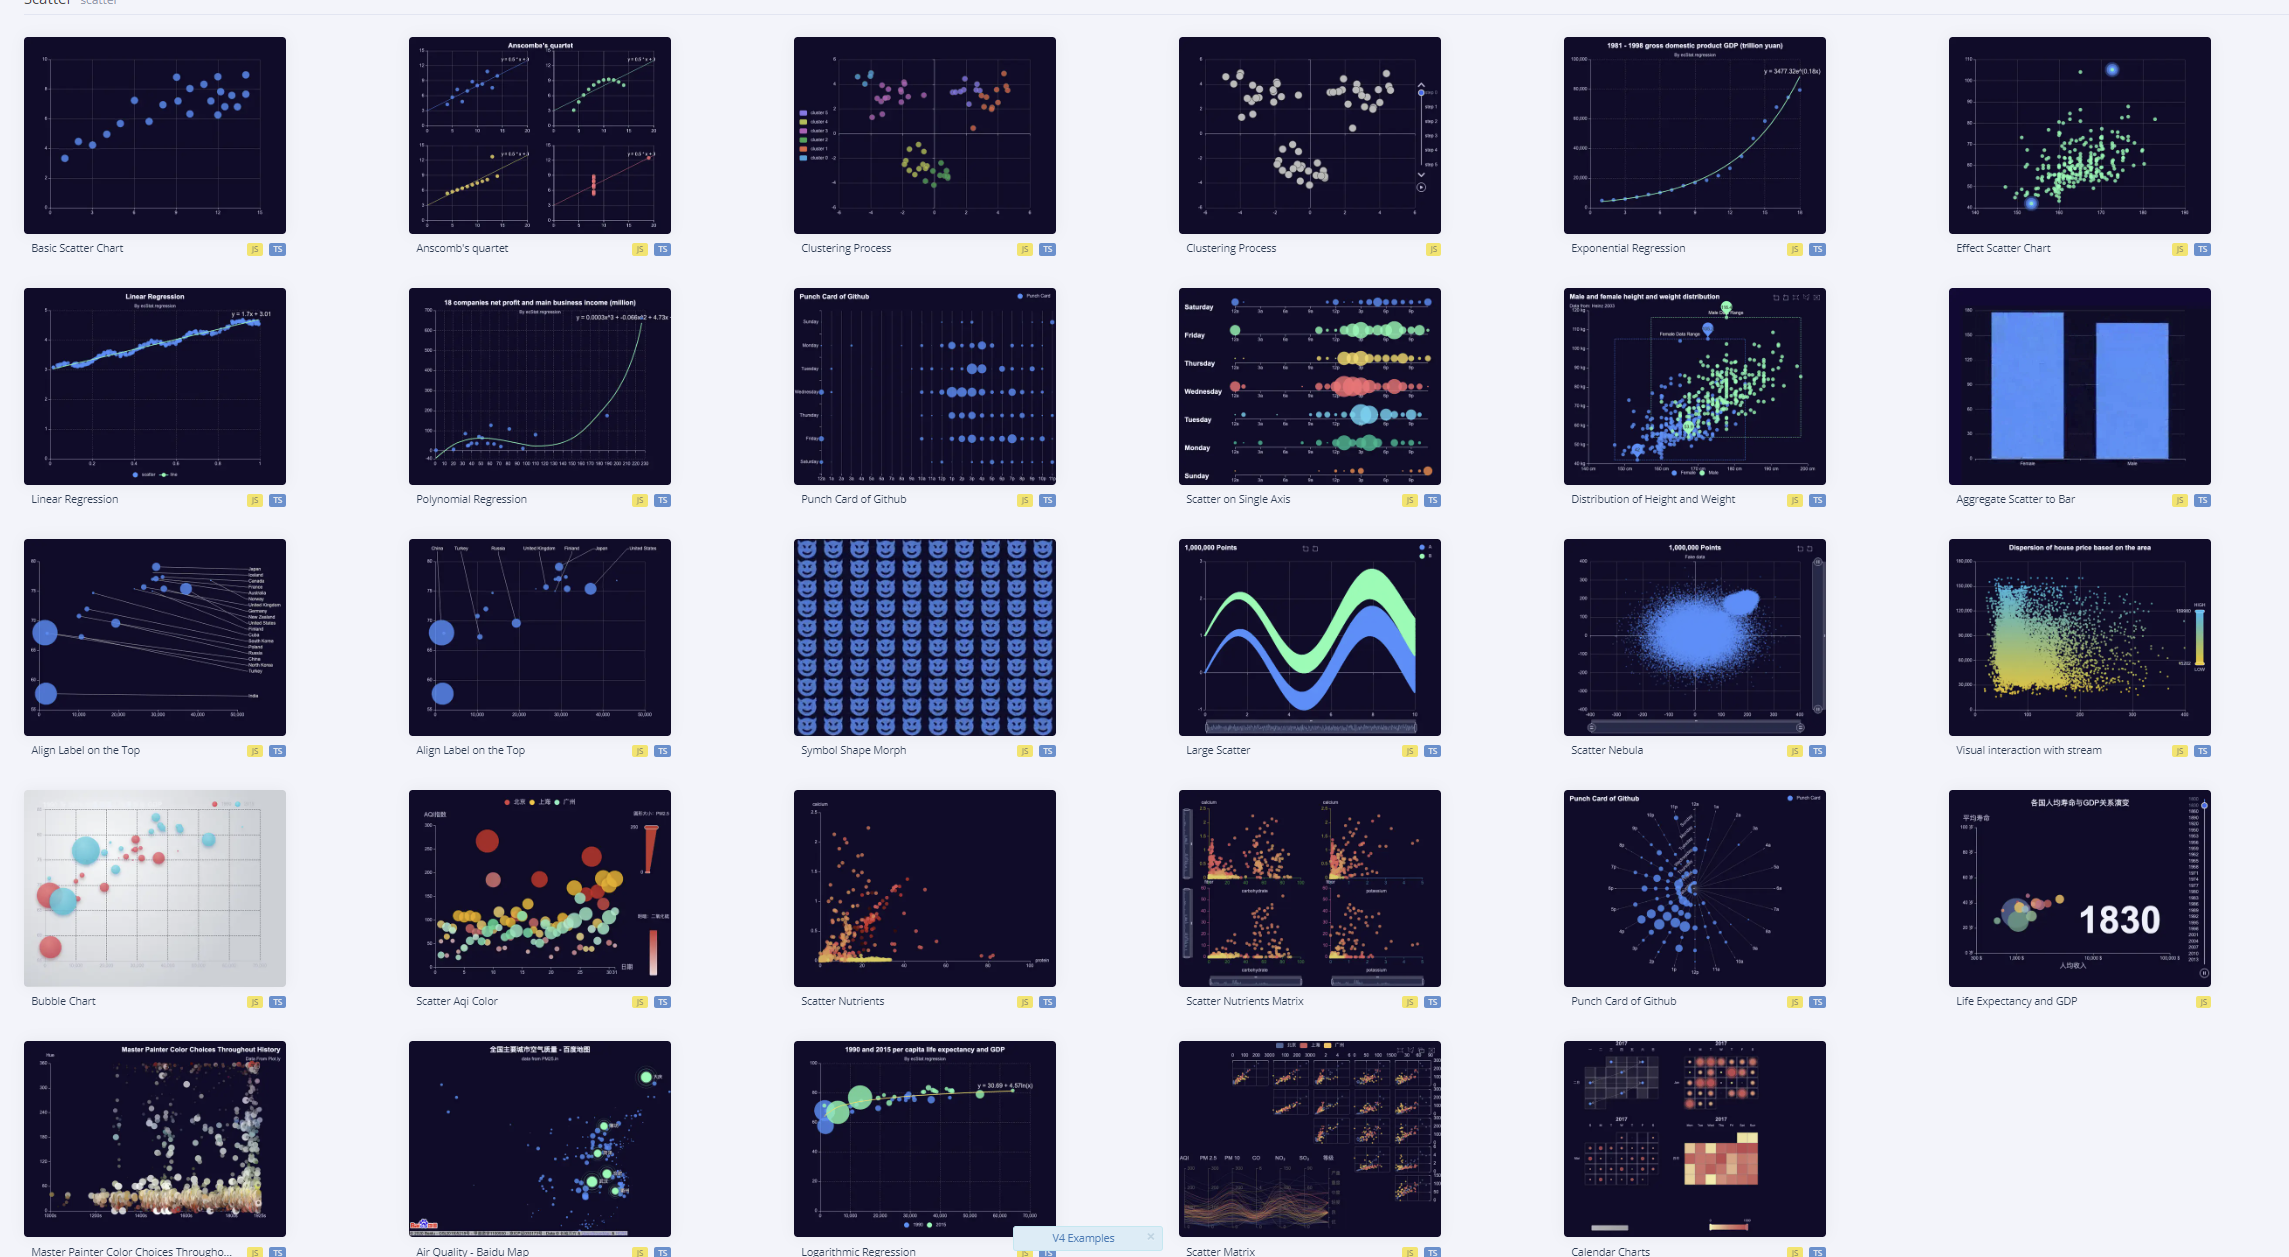
A picture tells a thousand words. Echarts helps you tell your story with data by making it beautiful. It helps people explore the world through data.
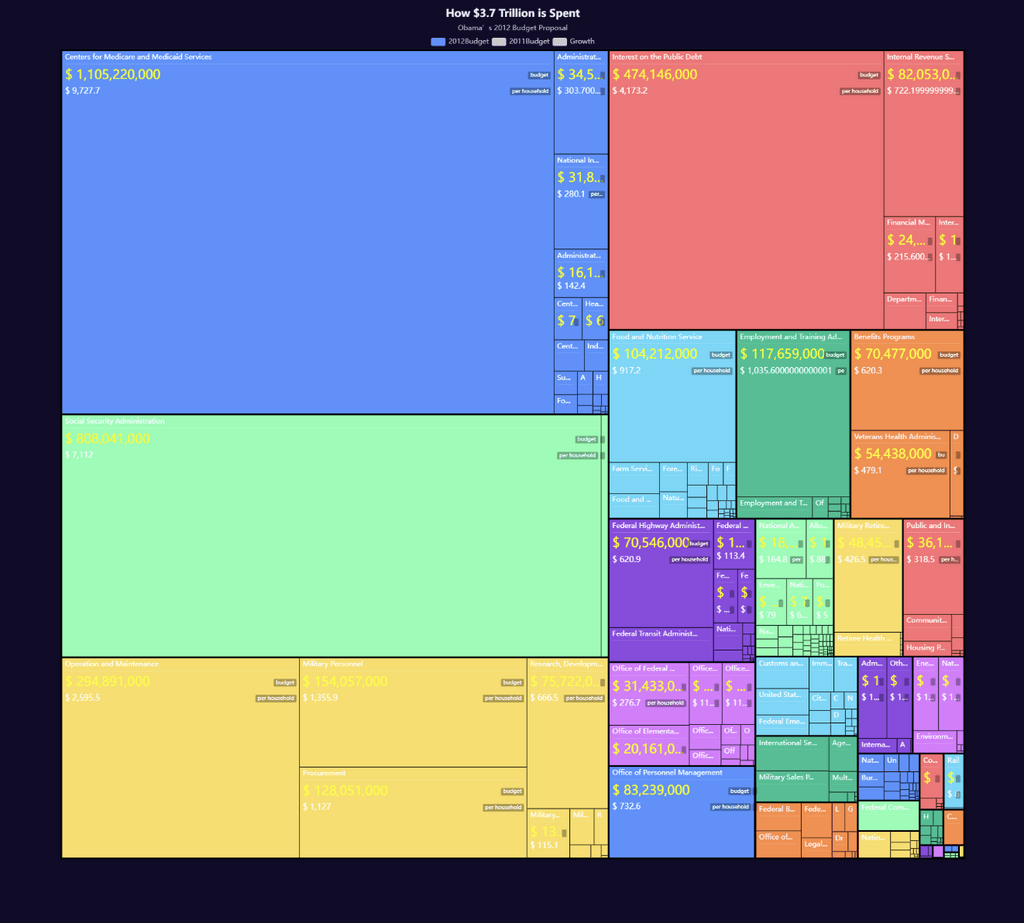
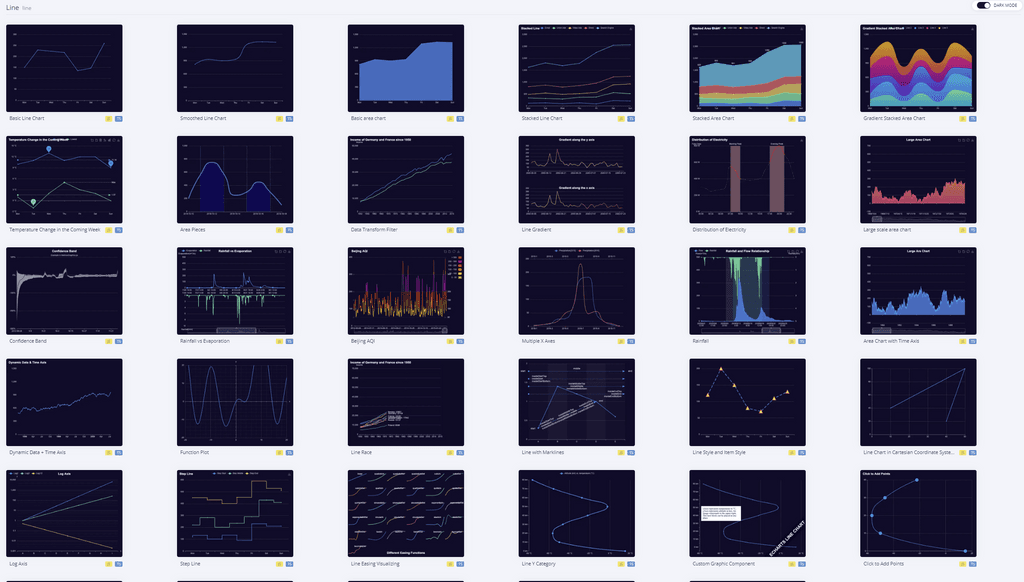
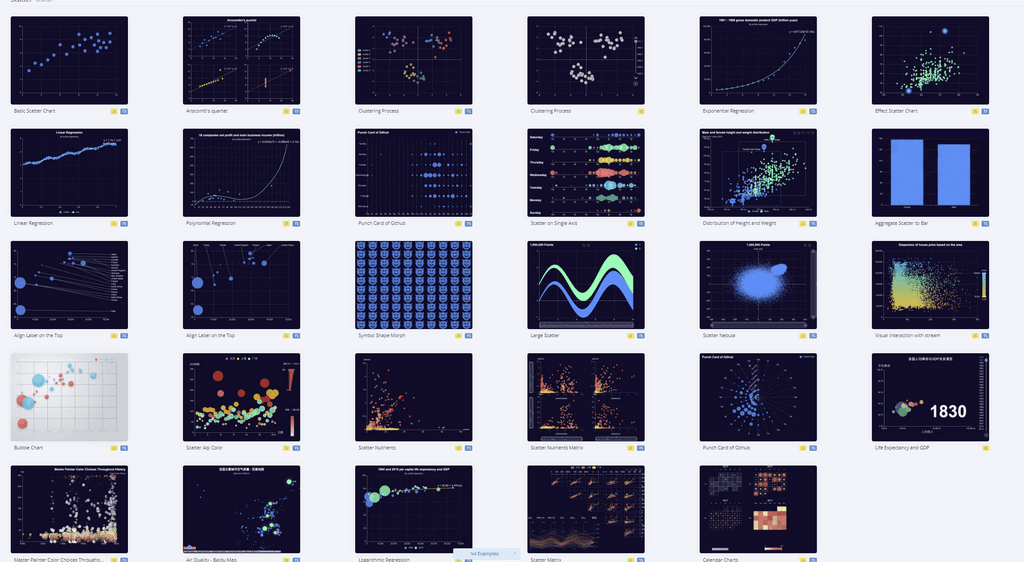
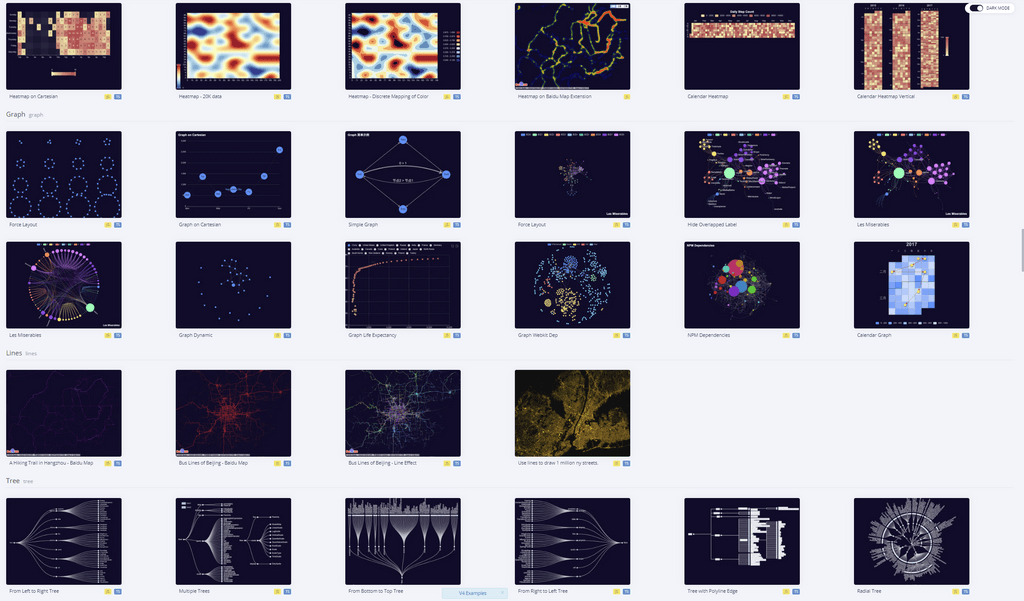
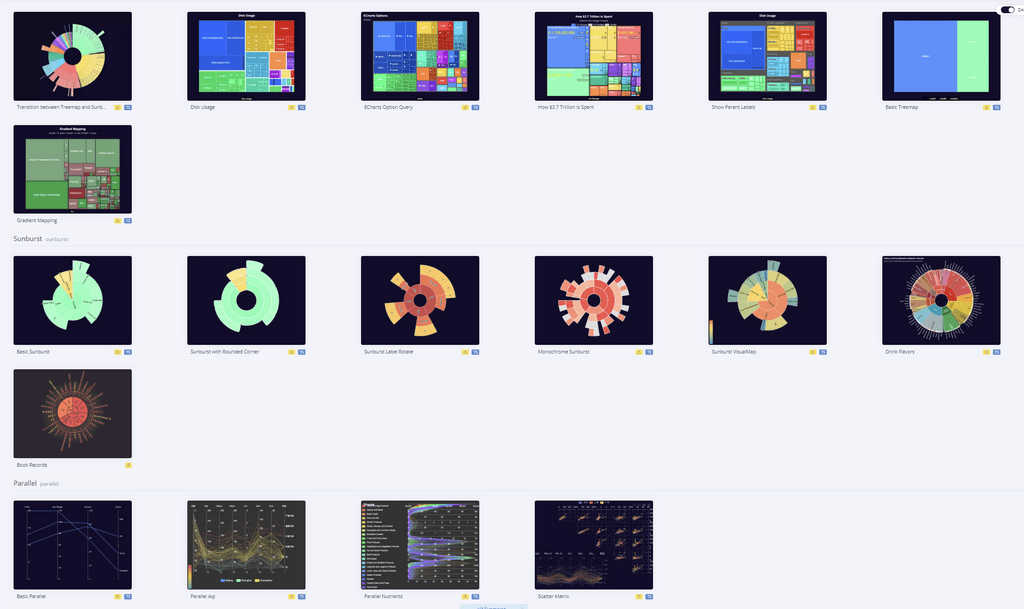
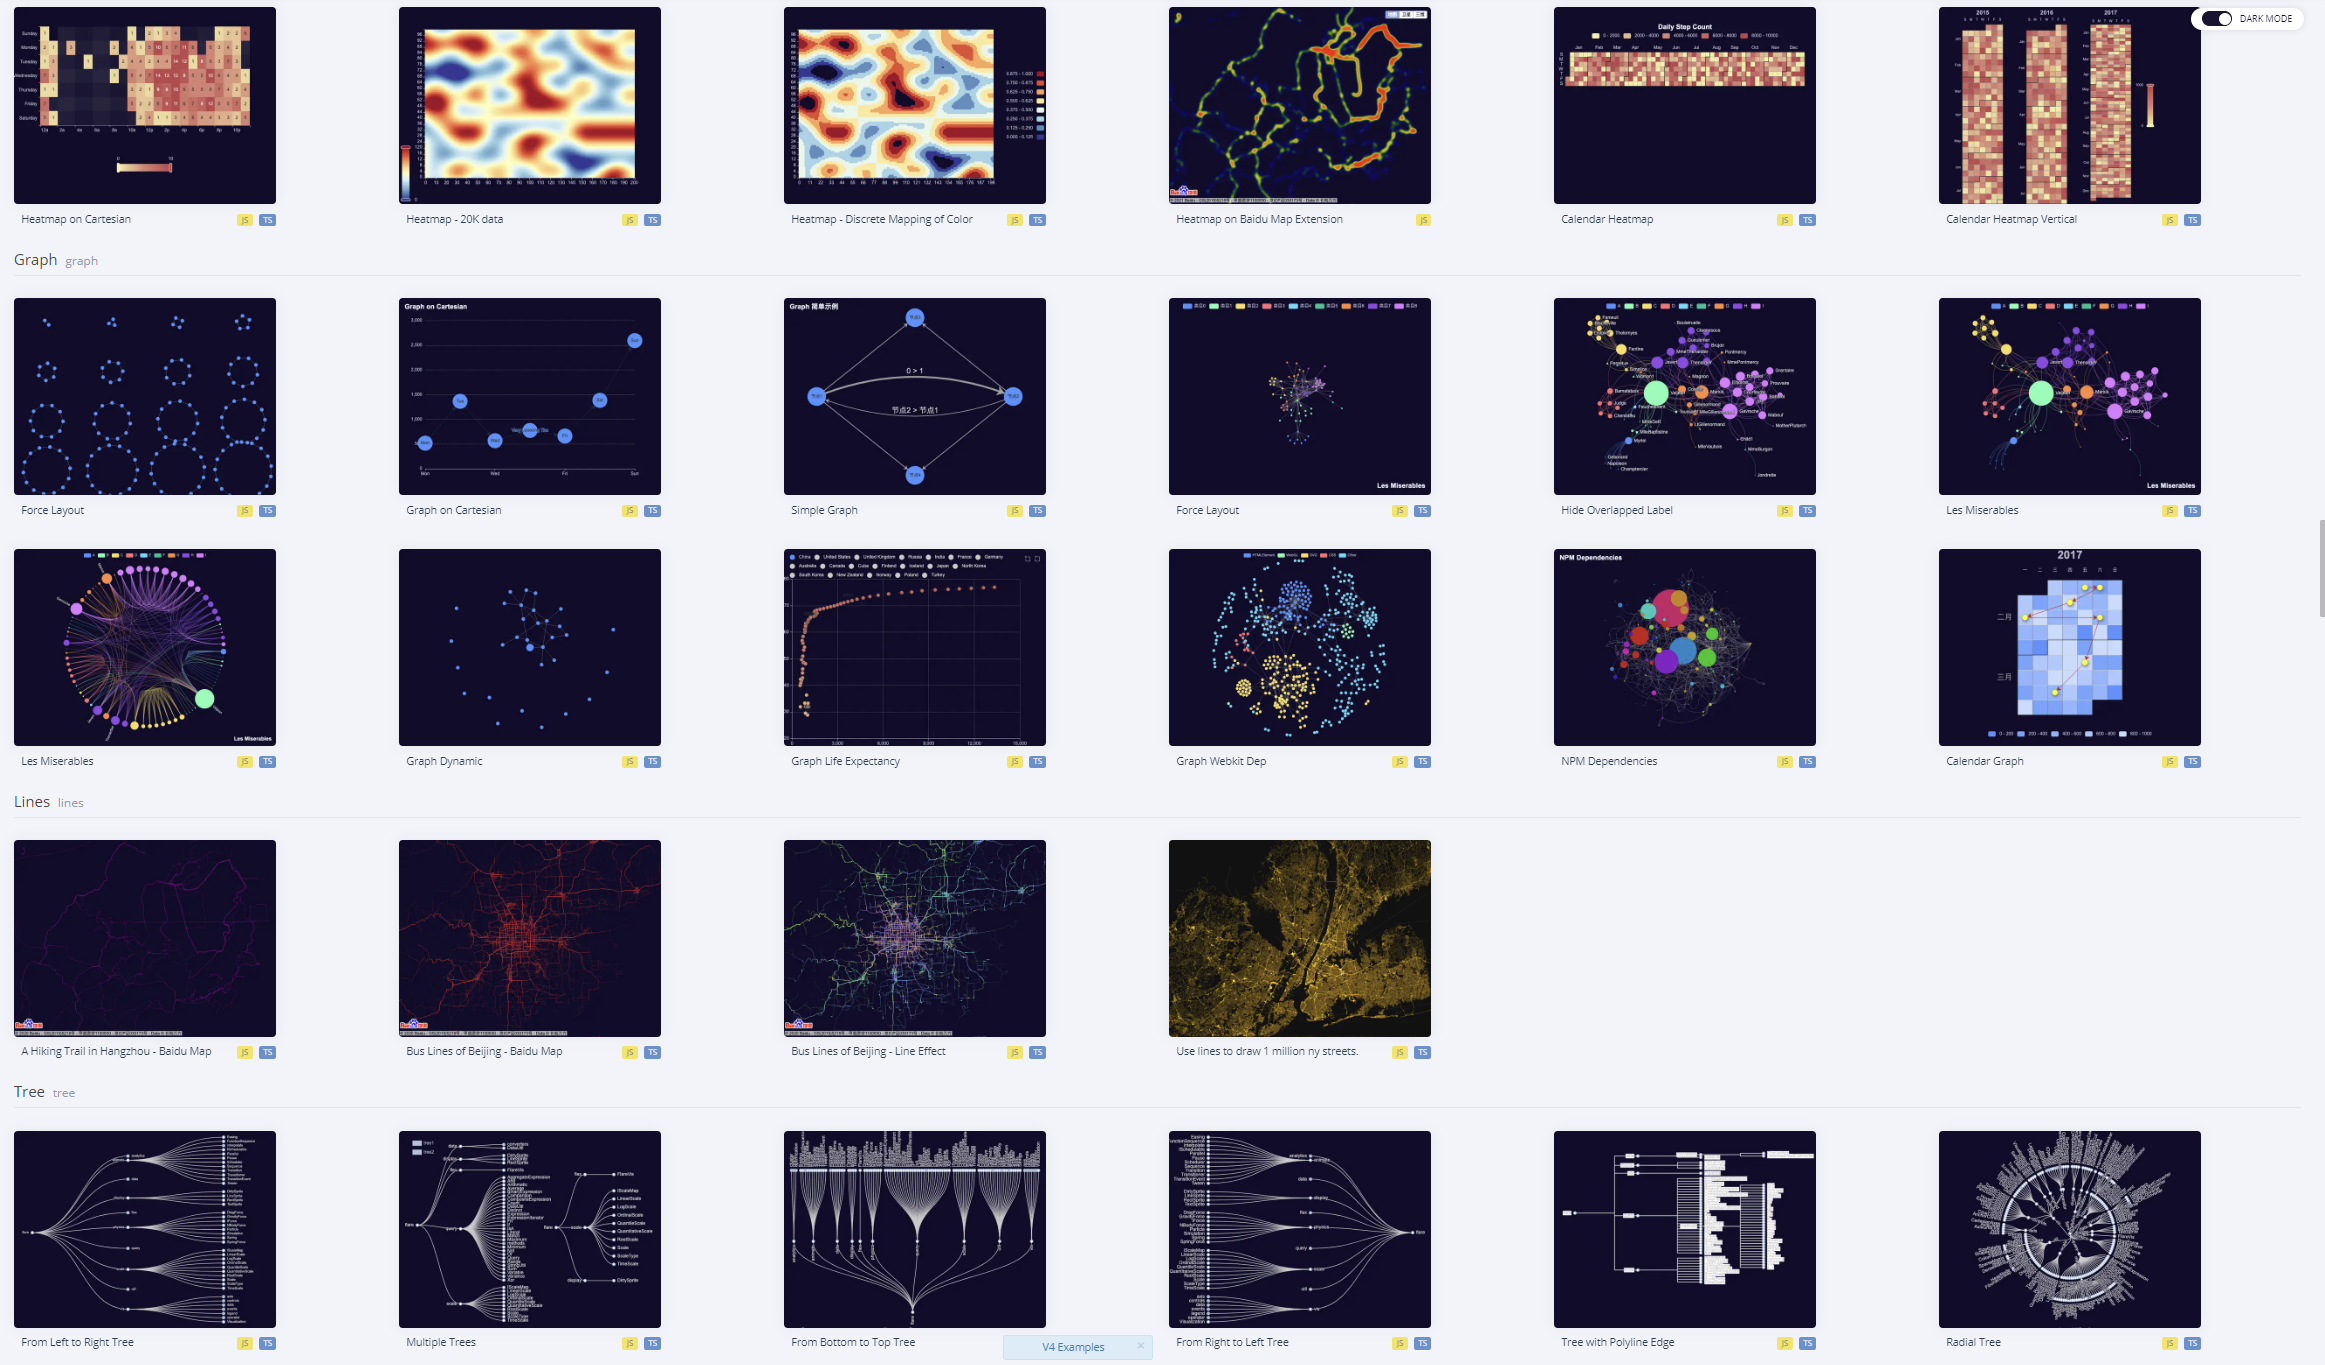
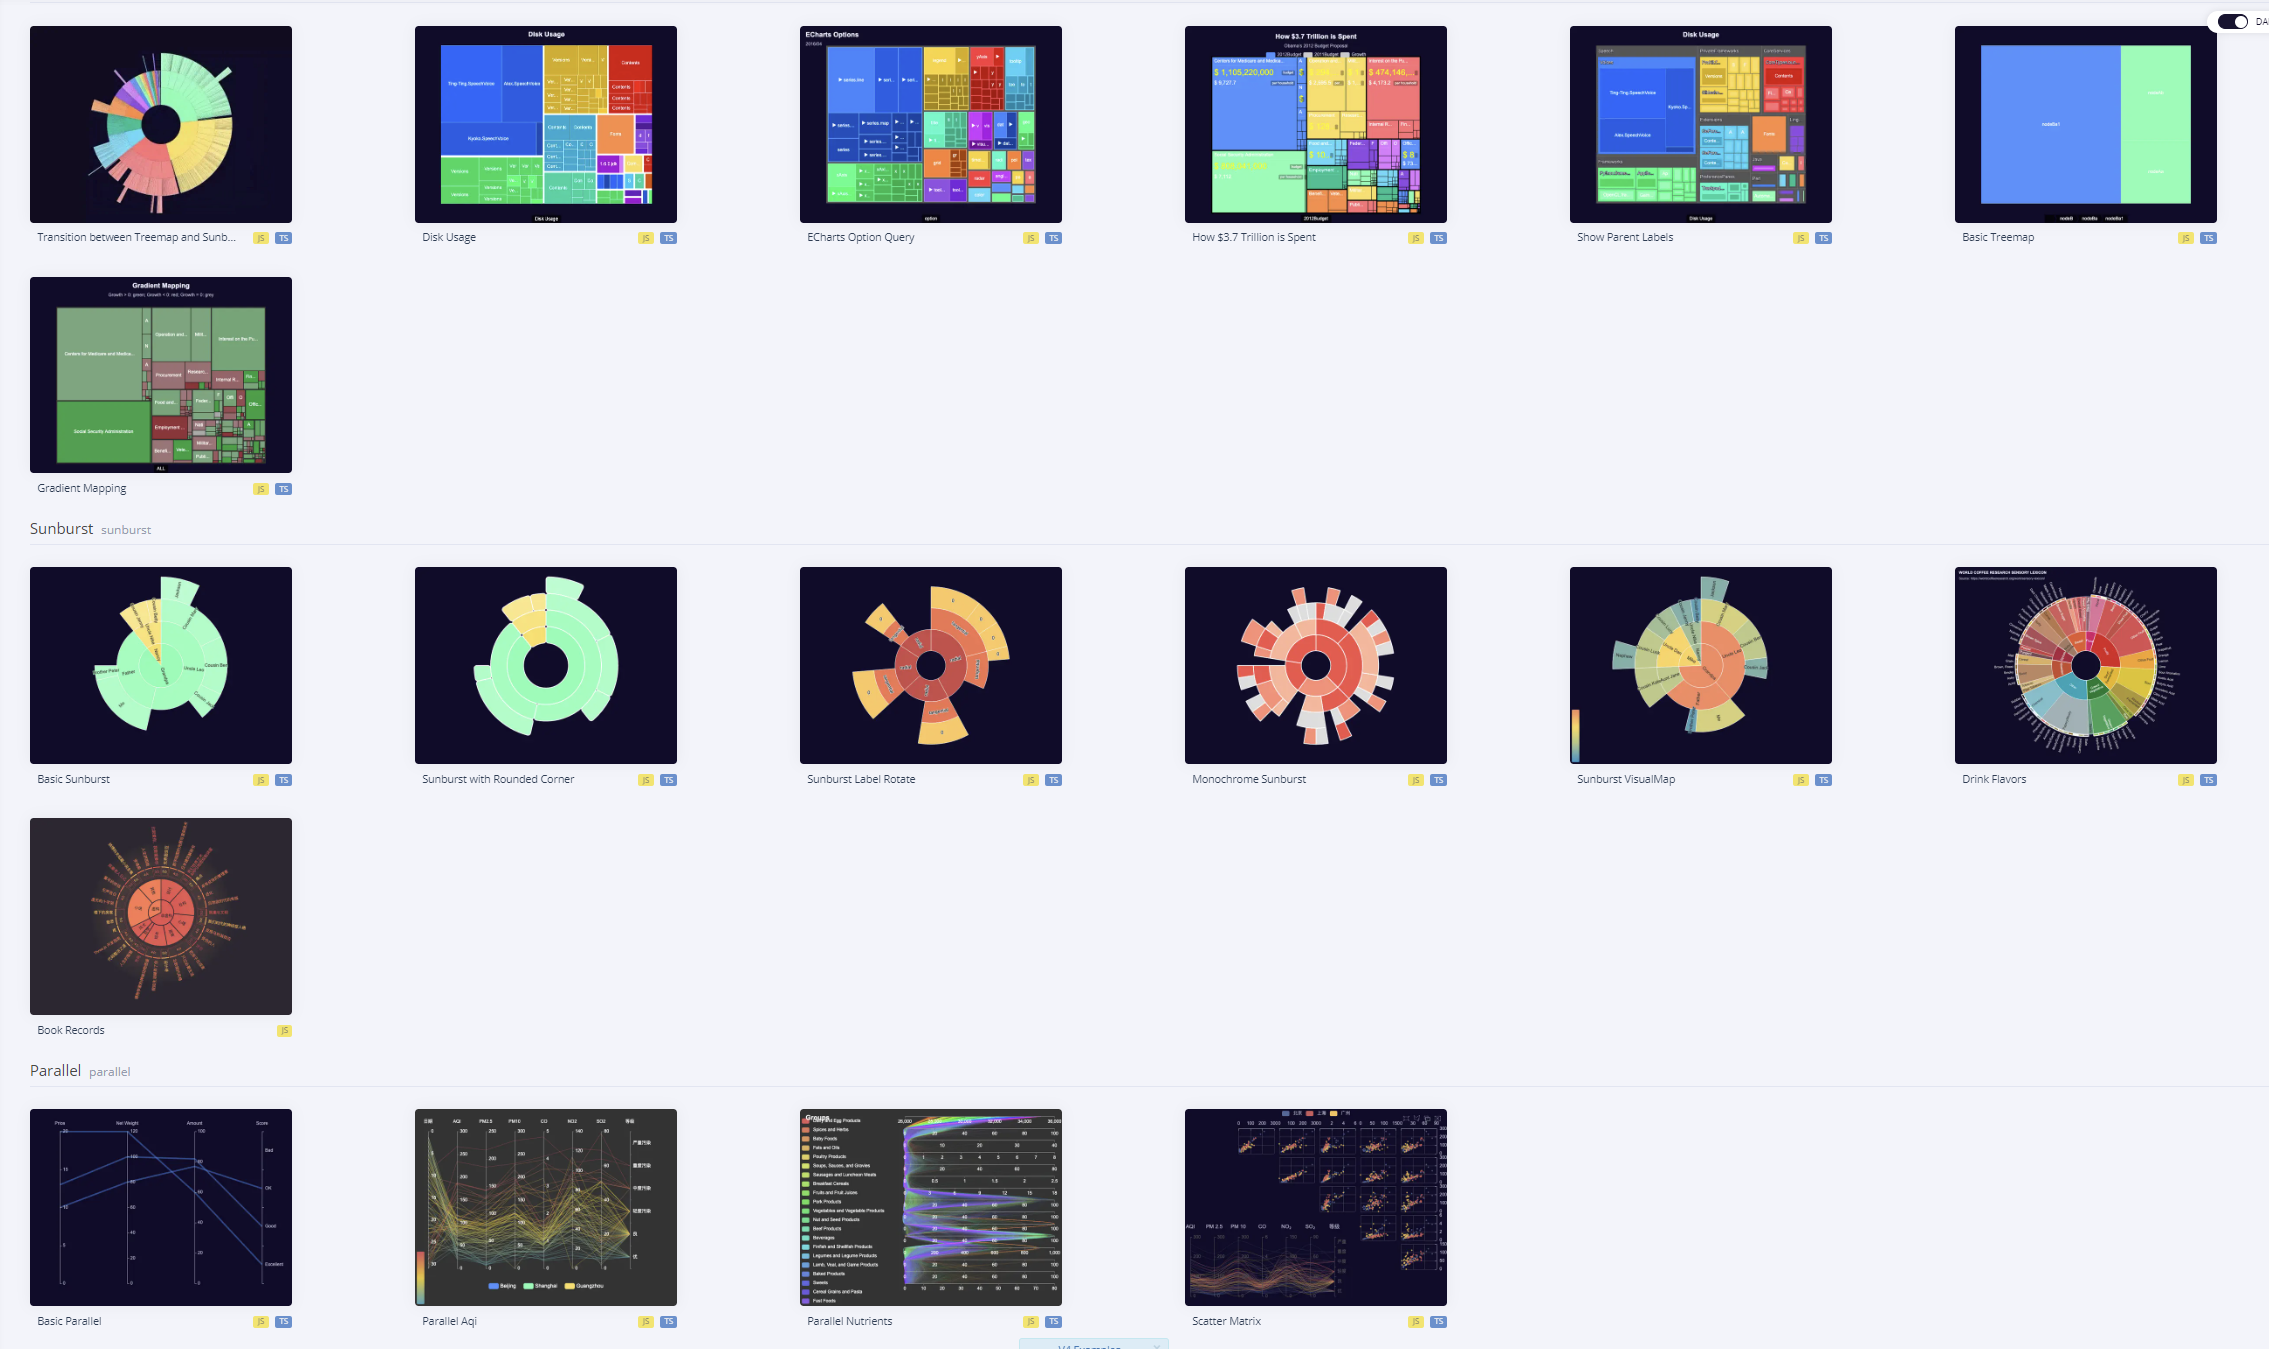
Apache ECharts is a free, powerful charting and visualization library offering easy ways to add intuitive, interactive, and highly customizable charts to your commercial products. It is written in pure JavaScript and based on zrender, which is a whole new lightweight canvas library.
-
Main Page: https://echarts.apache.org/en/index.html
-
Awesome Echarts: https://github.com/ecomfe/awesome-echarts
-
Installation is possible from npm
-
An extension is available for open source map project, Leaflet
-
Related to Cloudron's newly supported Apache project, Superset https://forum.cloudron.io/category/159/superset
-
-
L LoudLemur referenced this topic on
-
Ooooo, great find! Love a Sankey Chart!
 from me.
Data Analysis and report building is very much an in-demand role across all industries.
This Substack is well worth a subscribe to see some great financial charting:
Seems to use these tools:
-
Ooooo, great find! Love a Sankey Chart!
 from me.
Data Analysis and report building is very much an in-demand role across all industries.
This Substack is well worth a subscribe to see some great financial charting:
Seems to use these tools:
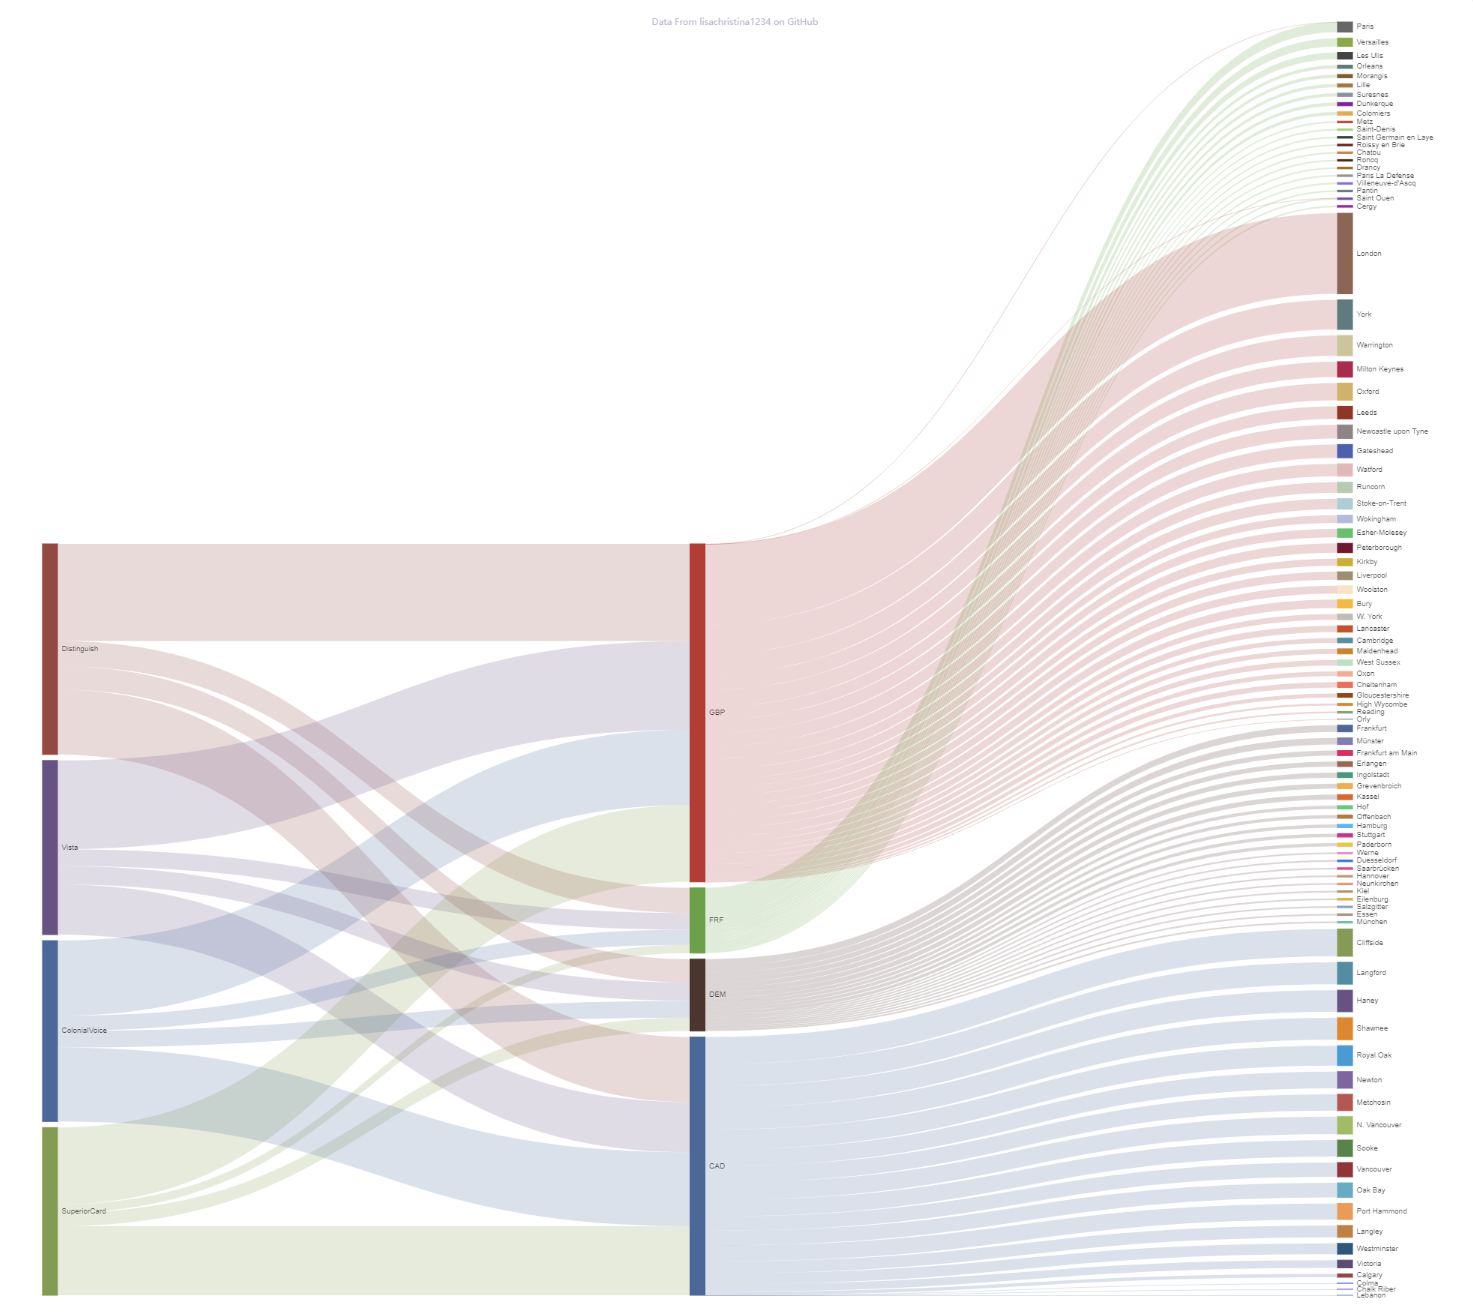
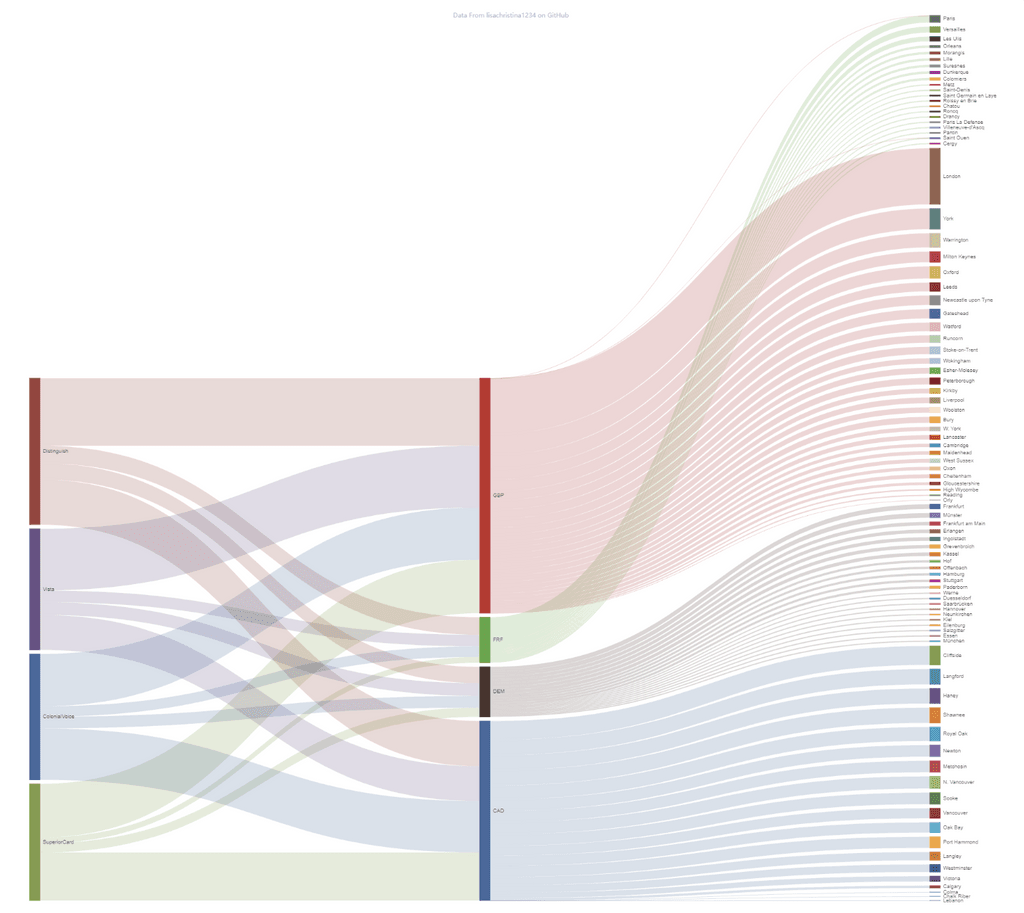
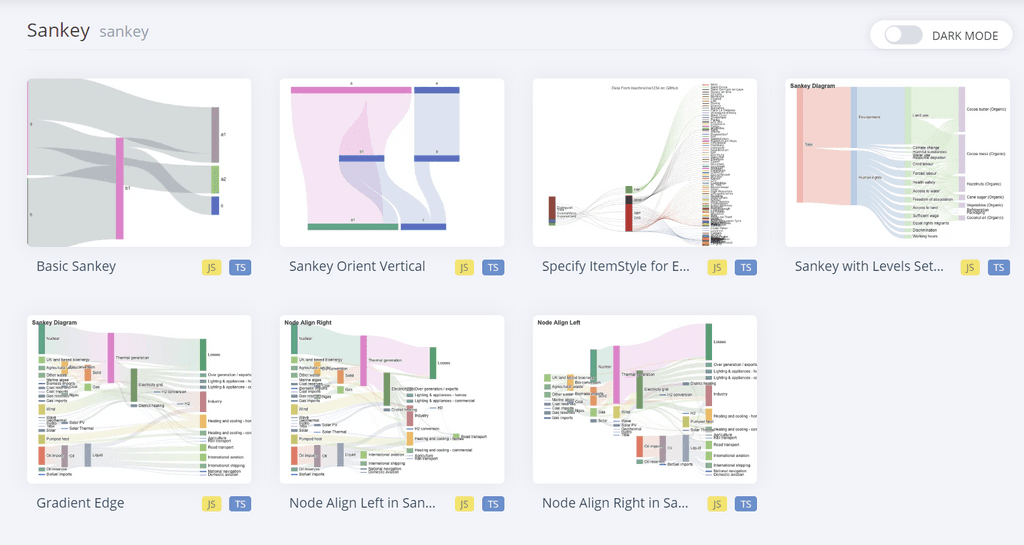
@marcusquinn Echarts has quite a few Sankey chart types:
-
Great find, haven't heard of this one before. But this looks like a library and not a webapp. Or maybe I am misunderstanding.
-
@girish said in Apache Echarts on Cloudron - Data Visualization:
Great find, haven't heard of this one before. But this looks like a library and not a webapp. Or maybe I am misunderstanding.
I suppose it is more like a library, @girish.
@LoudLemur Is that an add-on for Superset then?
-
Though this is a library, is there no way we could self-host it?
For example, there is eChartBuilder:
https://echarts.apache.org/en/builder.html

