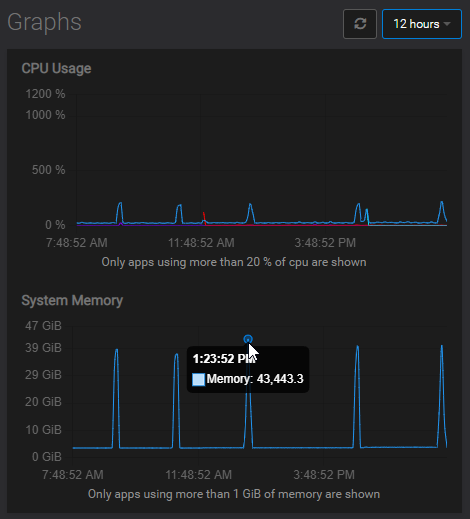
High memory usage spikes
-
@robi said in High memory usage spikes:
Box logs show nothing that correlates
How about the other logs from your system? If you havent done anything sketchy with your server outside of Cloudron, it should be Cloudron related so maybe check all logs and/or let @staff take a look at the problem.
-
@subven nothing unusual on my end..
syslogs show lots of packets dropped, so maybe a type of DDoS.
-
@subven agreed, there is no way to easily move from one app to another while looking at each apps graphs to compare network traffic.
And the system info doesn't have a network graph at all.
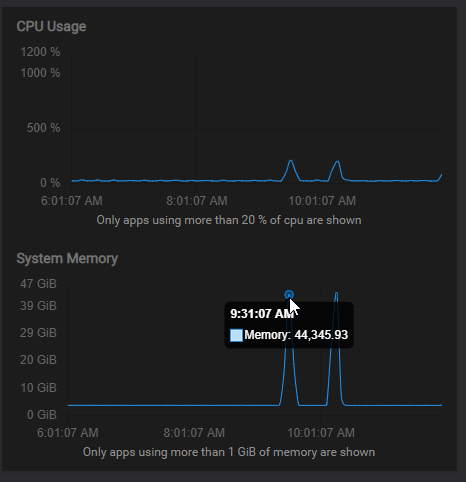
It happened again this morning at 9:31:07 and 10:16:07 with CPU spikes too:
syslog has tons of messages from this IP blasting everyone:
Jan 14 17:31:23 em kernel: [35147503.981778] Packet dropped: IN=enp3s0 OUT= MAC= ff:ff:ff:ff:ff:ff:52:54:a9:60:b1:6f:08:00 SRC=172.93.48.214 DST=255.255.255.255 LEN=62 TOS=0x00 PREC=0x00 TTL=64 ID=34492 PROTO=UDP SPT=52322 DPT=8888 LEN=42 -
Started monitoring via top, 'm' to see when it spikes what is happening..
this began taking 100% CPU:NI VIRT RES SHR S %CPU %MEM TIME+ COMMAND
0 0 0 0 R 100.0 0.0 1:36.15 kworker/7:1+events_freezable
0 0 0 0 S 55.8 0.0 9128:30 kswapd0g# free -h total used free shared buff/cache available Mem: 47Gi 44Gi 426Mi 228Mi 2.1Gi 1.7Gi Swap: 4.0Gi 1.4Gi 2.6Gi top - 22:11:56 up 406 days, 23:57, 3 users, load average: 3.38, 2.69, 1.51 Tasks: 477 total, 4 running, 473 sleeping, 0 stopped, 0 zombie %Cpu(s): 1.3 us, 14.1 sy, 0.0 ni, 84.4 id, 0.1 wa, 0.0 hi, 0.1 si, 0.0 st MiB Mem : 96.4/48195.9 [||||||||||||||||||||||||||||||||||||||||||||||||||| ] MiB Swap: 35.0/4096.0 [||||||||||||||||||| ] PID USER PR NI VIRT RES SHR S %CPU %MEM TIME+ COMMAND 2357779 root 20 0 0 0 0 R 100.0 0.0 5:17.08 kworker+ 157 root 20 0 0 0 0 R 59.5 0.0 9129:10 kswapd0 2449326 uuidd 20 0 393392 47296 5784 R 50.8 0.1 126:33.66 uwsgiWhat are these uwsgi processes?
Seems like a python related memory leak needing atweak to the uswgi.ini?
https://levelup.gitconnected.com/the-experience-of-solving-memory-leak-of-django-uwsgi-nginx-aws-cdb998244cfb
-
Started monitoring via top, 'm' to see when it spikes what is happening..
this began taking 100% CPU:NI VIRT RES SHR S %CPU %MEM TIME+ COMMAND
0 0 0 0 R 100.0 0.0 1:36.15 kworker/7:1+events_freezable
0 0 0 0 S 55.8 0.0 9128:30 kswapd0g# free -h total used free shared buff/cache available Mem: 47Gi 44Gi 426Mi 228Mi 2.1Gi 1.7Gi Swap: 4.0Gi 1.4Gi 2.6Gi top - 22:11:56 up 406 days, 23:57, 3 users, load average: 3.38, 2.69, 1.51 Tasks: 477 total, 4 running, 473 sleeping, 0 stopped, 0 zombie %Cpu(s): 1.3 us, 14.1 sy, 0.0 ni, 84.4 id, 0.1 wa, 0.0 hi, 0.1 si, 0.0 st MiB Mem : 96.4/48195.9 [||||||||||||||||||||||||||||||||||||||||||||||||||| ] MiB Swap: 35.0/4096.0 [||||||||||||||||||| ] PID USER PR NI VIRT RES SHR S %CPU %MEM TIME+ COMMAND 2357779 root 20 0 0 0 0 R 100.0 0.0 5:17.08 kworker+ 157 root 20 0 0 0 0 R 59.5 0.0 9129:10 kswapd0 2449326 uuidd 20 0 393392 47296 5784 R 50.8 0.1 126:33.66 uwsgiWhat are these uwsgi processes?
Seems like a python related memory leak needing atweak to the uswgi.ini?
https://levelup.gitconnected.com/the-experience-of-solving-memory-leak-of-django-uwsgi-nginx-aws-cdb998244cfb@robi said in High memory usage spikes:
kworker+
Guess you've now seen these?
https://www.linuxquestions.org/questions/linux-software-2/high-cpu-usage-by-kworker-4175563563/
https://askubuntu.com/questions/33640/kworker-what-is-it-and-why-is-it-hogging-so-much-cpu
Oh, and look, this person on SSDNodes also has a very similar issue:
I'm gonna take this as yet another reason to not touch them with a barge pole!

-
@robi said in High memory usage spikes:
kworker+
Guess you've now seen these?
https://www.linuxquestions.org/questions/linux-software-2/high-cpu-usage-by-kworker-4175563563/
https://askubuntu.com/questions/33640/kworker-what-is-it-and-why-is-it-hogging-so-much-cpu
Oh, and look, this person on SSDNodes also has a very similar issue:
I'm gonna take this as yet another reason to not touch them with a barge pole!
@jdaviescoates that doesn't seem related..
# cat /proc/vmstat | grep -E "dirty|writeback"
nr_dirty 1166
nr_writeback 0
nr_writeback_temp 0
nr_dirty_threshold 2192736
nr_dirty_background_threshold 1095029
I'll set
echo 10000 > /proc/sys/vm/dirty_writeback_centisecsand see what happens. -
@jdaviescoates that doesn't seem related..
# cat /proc/vmstat | grep -E "dirty|writeback"
nr_dirty 1166
nr_writeback 0
nr_writeback_temp 0
nr_dirty_threshold 2192736
nr_dirty_background_threshold 1095029
I'll set
echo 10000 > /proc/sys/vm/dirty_writeback_centisecsand see what happens.@robi in case you missed, I added a few other links, including this one more similar with someone also on SSDNodes (I think that's who you're using too, right?)
-
@robi in case you missed, I added a few other links, including this one more similar with someone also on SSDNodes (I think that's who you're using too, right?)
@jdaviescoates Yep, nice find.. it might be something they're doing. Will send them a note.
-
Haven't been able to find where this lives:
2451531 ? Sl 127:28 5 0 393392 47284 0.0 uwsgi --master --workers 2 --buffer-size 16384 --no-orphans --ini /etc/uwsgi/apps-enabled/graphite-uwsgi.iniand since when do we have such lengthy PIDs?
-
Haven't been able to find where this lives:
2451531 ? Sl 127:28 5 0 393392 47284 0.0 uwsgi --master --workers 2 --buffer-size 16384 --no-orphans --ini /etc/uwsgi/apps-enabled/graphite-uwsgi.iniand since when do we have such lengthy PIDs?
@robi that looks like the graphite container . Does that service have enough memory (under Services) ? You can also nuke
/home/yellowtent/platformdata/graphite/whisper/collectd/localhost/*entirely and restart graphite. Maybe some corrupt whisper db file is causing issues. -
@robi that looks like the graphite container . Does that service have enough memory (under Services) ? You can also nuke
/home/yellowtent/platformdata/graphite/whisper/collectd/localhost/*entirely and restart graphite. Maybe some corrupt whisper db file is causing issues.
Hello! It looks like you're interested in this conversation, but you don't have an account yet.
Getting fed up of having to scroll through the same posts each visit? When you register for an account, you'll always come back to exactly where you were before, and choose to be notified of new replies (either via email, or push notification). You'll also be able to save bookmarks and upvote posts to show your appreciation to other community members.
With your input, this post could be even better 💗
Register Login