-
@natzilla Was trying to check if we hit some parsing error in the code. Can you give me the output of
docker stats --format "{{ json . }}" --no-stream --no-trunc | grep 2058a37598b0?@girish as requested
{"BlockIO":"171GB / 83.4GB","CPUPerc":"0.14%","Container":"2058a37598b0","ID":"2058a37598b013a36a5a3d05a362e96dc4ad212dec1d5db162e372979bc47c38","MemPerc":"84.77%","MemUsage":"24.68GiB / 29.12GiB","Name":"7d771f27-4c9e-48ff-b0ff-3c742305adb3","NetIO":"1.27GB / 410GB","PIDs":"57"}
-
@girish as requested
{"BlockIO":"171GB / 83.4GB","CPUPerc":"0.14%","Container":"2058a37598b0","ID":"2058a37598b013a36a5a3d05a362e96dc4ad212dec1d5db162e372979bc47c38","MemPerc":"84.77%","MemUsage":"24.68GiB / 29.12GiB","Name":"7d771f27-4c9e-48ff-b0ff-3c742305adb3","NetIO":"1.27GB / 410GB","PIDs":"57"}
-
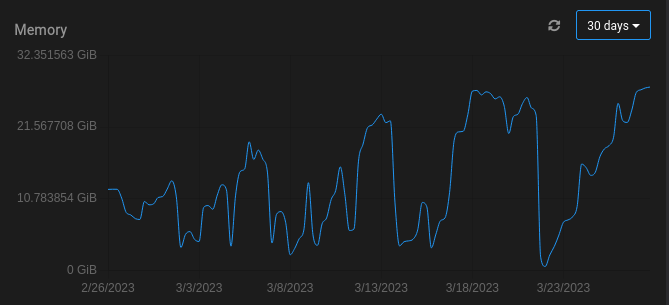
@natzilla So, the values in the graph come from the json you posted. Specifically
"MemUsage":"24.68GiB / 29.12GiB". (memory used / memory max) . This sort of matches what's displayed in the graph. -
@natzilla I was asking who the provider was, as sometimes they have a virtualization platform that can cause this as a way to reclaim memory for the underlying host from hungry VMs, etc.
Hello! It looks like you're interested in this conversation, but you don't have an account yet.
Getting fed up of having to scroll through the same posts each visit? When you register for an account, you'll always come back to exactly where you were before, and choose to be notified of new replies (either via email, or push notification). You'll also be able to save bookmarks and upvote posts to show your appreciation to other community members.
With your input, this post could be even better 💗
Register Login