-
 N nebulon moved this topic from Support on
-
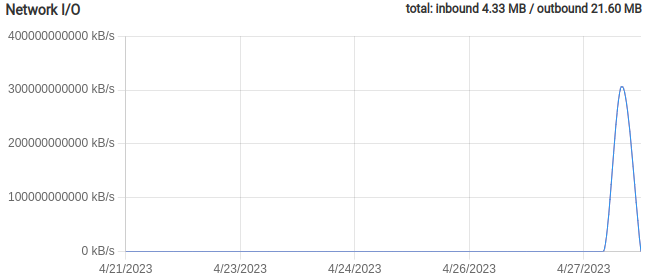
In the network I/O graph, the data unit used is the kilobyte. The issue here is that it's not very useful from an analysis perspective. Shouldn't this be either configurable by an admin/by default be in mB.
-
In the network I/O graph, the data unit used is the kilobyte. The issue here is that it's not very useful from an analysis perspective. Shouldn't this be either configurable by an admin/by default be in mB.
-
 G girish moved this topic from Feature Requests on
-
Where can one find this graph?
Edit: ah in the Graphs section of App Settings.
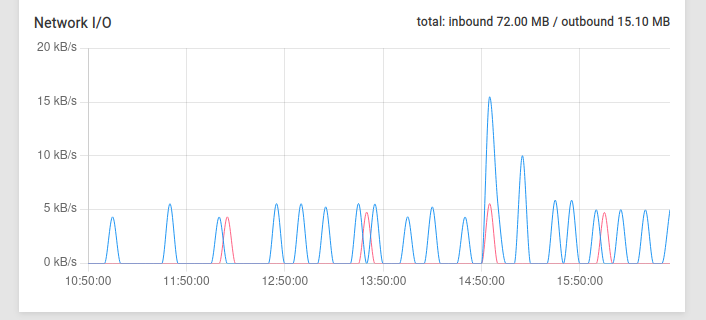
Here's one of mine:
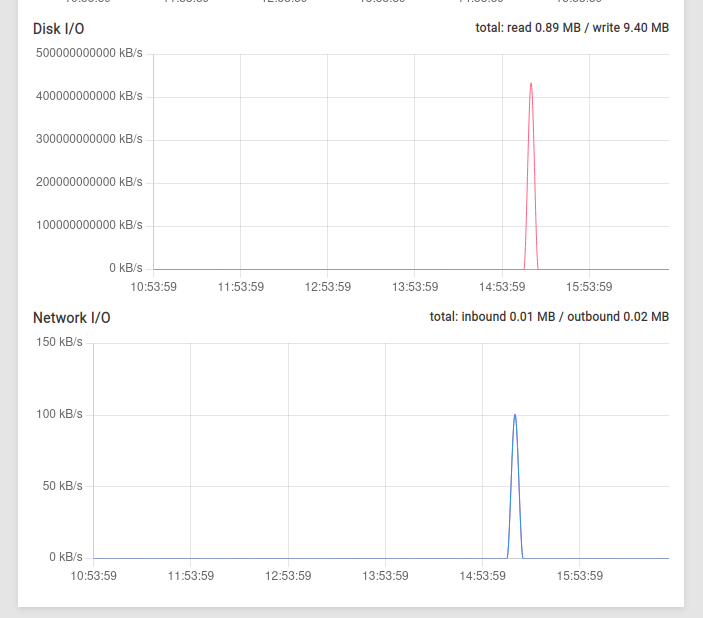
Update:
And here another where Disk I/O has a similar strange issue to what @Lanhild is seeing in his Network I/O
-
Where can one find this graph?
Edit: ah in the Graphs section of App Settings.
Here's one of mine:
Update:
And here another where Disk I/O has a similar strange issue to what @Lanhild is seeing in his Network I/O
-
@jdaviescoates can you post the output of
docker stats?@girish said in Application network I/O graph shouldn't be in kilobytes per second:
@jdaviescoates can you post the output of docker stats ?
From where?
The Web Terminal of the App in question? Didn't seem to work there so I ssh'd into the server and ran it there.
The line for the app in question (with the funny Disk I/O graph) is:
CPU %     MEM USAGE / LIMIT     MEM %     NET I/O           BLOCK I/O         PIDS

5.81%     293.4MiB / 2.4GiB     11.94%    805kB / 914kB     363MB / 13.3MB    18
Does that shed any light on anything?
-
G girish marked this topic as a question on
-
@Lanhild Do you see this in all views? It seems like something is corrupt. After all the inbound and outbound is so low, it seem unlikely the network speed I/O is so high.
-
 J james has marked this topic as solved on
Hello! It looks like you're interested in this conversation, but you don't have an account yet.
Getting fed up of having to scroll through the same posts each visit? When you register for an account, you'll always come back to exactly where you were before, and choose to be notified of new replies (either via email, or push notification). You'll also be able to save bookmarks and upvote posts to show your appreciation to other community members.
With your input, this post could be even better 💗
Register Login