Disk graphs not loading for external disk mounts.
-
Hello,
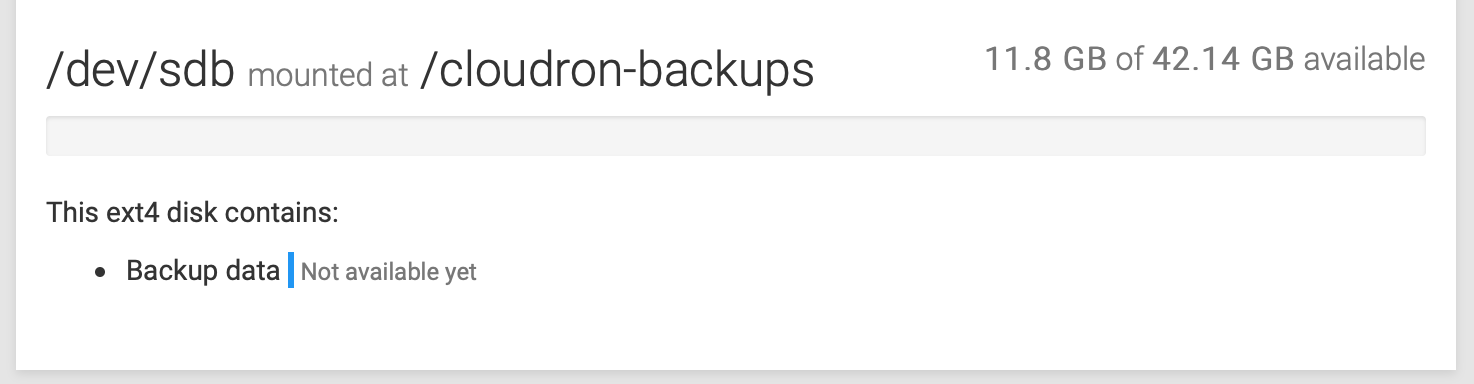
This was working prior to 5.1.4, so presumably an issue in 5.1.4. The graphs and data underneath the graph do not show anything for external disks. Works fine for local disks, but not external. Screenshot below. This is the case even after a restart.
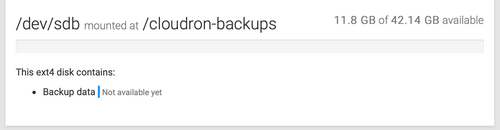
You'll notice that the disk usage stat is accurate, but there is no graph data and no size of consumption below the graph, continuously says "Not available yet".
-
How come I still can't see any disk in my Cloudron but just a spinning circle?
df -hgivesDateisystem Größe Benutzt Verf. Verw% Eingehängt auf udev 3,8G 0 3,8G 0% /dev tmpfs 765M 3,2M 762M 1% /run /dev/mapper/beebox--vg-root 455G 329G 103G 77% / tmpfs 3,8G 8,0K 3,8G 1% /dev/shm tmpfs 5,0M 0 5,0M 0% /run/lock tmpfs 3,8G 0 3,8G 0% /sys/fs/cgroup /dev/loop0 9,2M 9,2M 0 100% /snap/canonical-livepatch/95 /dev/loop1 55M 55M 0 100% /snap/core18/1705 /dev/loop2 55M 55M 0 100% /snap/core18/1668 /dev/loop3 9,2M 9,2M 0 100% /snap/canonical-livepatch/94 /dev/loop4 92M 92M 0 100% /snap/core/8689 /dev/loop5 94M 94M 0 100% /snap/core/8935 /dev/sdb1 472M 145M 303M 33% /boot /dev/sda1 1,8T 1,4T 371G 79% /media/SG2TB -
It seems to appear fine for me here:
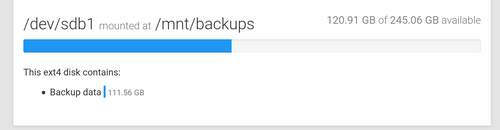
Can you check if restarting graphite (from services view) helps? You can also try
systemctl restart collectdvia SSH.@girish I just logged in to restart Graphite and go figure - without even having to do that it suddenly started working. lol. No idea why that was the case, as it wasn't loading after two different reboots, and across different days as well. But it seems to currently be working so going to be hard to determine the root cause, but I suspect you're right that it was likely Graphite since that's the component that does the graphing I think, right?
-
It seems to appear fine for me here:
Can you check if restarting graphite (from services view) helps? You can also try
systemctl restart collectdvia SSH.@girish For what's worth, I just looked at the Graphite logs and it displays a lot of these. Is this possibly an issue or is this expected behaviour?
Apr 16 12:00:14 16/04/2020 19:00:14 :: [console] /etc/carbon/storage-aggregation.conf not found or wrong perms, ignoring.
Apr 16 12:01:14 16/04/2020 19:01:14 :: [console] /etc/carbon/storage-aggregation.conf not found or wrong perms, ignoring.
Apr 16 12:02:14 16/04/2020 19:02:14 :: [console] /etc/carbon/storage-aggregation.conf not found or wrong perms, ignoring.
Apr 16 12:03:14 16/04/2020 19:03:14 :: [console] /etc/carbon/storage-aggregation.conf not found or wrong perms, ignoring.
Apr 16 12:04:14 16/04/2020 19:04:14 :: [console] /etc/carbon/storage-aggregation.conf not found or wrong perms, ignoring.
Apr 16 12:05:14 16/04/2020 19:05:14 :: [console] /etc/carbon/storage-aggregation.conf not found or wrong perms, ignoring.
Apr 16 12:06:14 16/04/2020 19:06:14 :: [console] /etc/carbon/storage-aggregation.conf not found or wrong perms, ignoring.
--
Dustin Dauncey
www.d19.ca -
How come I still can't see any disk in my Cloudron but just a spinning circle?
df -hgivesDateisystem Größe Benutzt Verf. Verw% Eingehängt auf udev 3,8G 0 3,8G 0% /dev tmpfs 765M 3,2M 762M 1% /run /dev/mapper/beebox--vg-root 455G 329G 103G 77% / tmpfs 3,8G 8,0K 3,8G 1% /dev/shm tmpfs 5,0M 0 5,0M 0% /run/lock tmpfs 3,8G 0 3,8G 0% /sys/fs/cgroup /dev/loop0 9,2M 9,2M 0 100% /snap/canonical-livepatch/95 /dev/loop1 55M 55M 0 100% /snap/core18/1705 /dev/loop2 55M 55M 0 100% /snap/core18/1668 /dev/loop3 9,2M 9,2M 0 100% /snap/canonical-livepatch/94 /dev/loop4 92M 92M 0 100% /snap/core/8689 /dev/loop5 94M 94M 0 100% /snap/core/8935 /dev/sdb1 472M 145M 303M 33% /boot /dev/sda1 1,8T 1,4T 371G 79% /media/SG2TB -
@girish For what's worth, I just looked at the Graphite logs and it displays a lot of these. Is this possibly an issue or is this expected behaviour?
Apr 16 12:00:14 16/04/2020 19:00:14 :: [console] /etc/carbon/storage-aggregation.conf not found or wrong perms, ignoring. Apr 16 12:01:14 16/04/2020 19:01:14 :: [console] /etc/carbon/storage-aggregation.conf not found or wrong perms, ignoring. Apr 16 12:02:14 16/04/2020 19:02:14 :: [console] /etc/carbon/storage-aggregation.conf not found or wrong perms, ignoring. Apr 16 12:03:14 16/04/2020 19:03:14 :: [console] /etc/carbon/storage-aggregation.conf not found or wrong perms, ignoring. Apr 16 12:04:14 16/04/2020 19:04:14 :: [console] /etc/carbon/storage-aggregation.conf not found or wrong perms, ignoring. Apr 16 12:05:14 16/04/2020 19:05:14 :: [console] /etc/carbon/storage-aggregation.conf not found or wrong perms, ignoring. Apr 16 12:06:14 16/04/2020 19:06:14 :: [console] /etc/carbon/storage-aggregation.conf not found or wrong perms, ignoring.@d19dotca Yeah, that warning can be ignored. That file is missing because we don't use aggregation in carbon.
About the disk graphs. The disk graphs currently uses 2 bits of information - one which is just plain
dfoutput which is queried the instant you hit the graphs page and another which is directory level/app level and polled periodically by collectd. The issue here is that this periodic polling only happens twice a day (otherwise, we keep spinning up the disk too much). I think a good way to fix it is to inform the user that graphs will appear in 12 hours or something like that when we don't have data. -
FYI, I have the same errors:
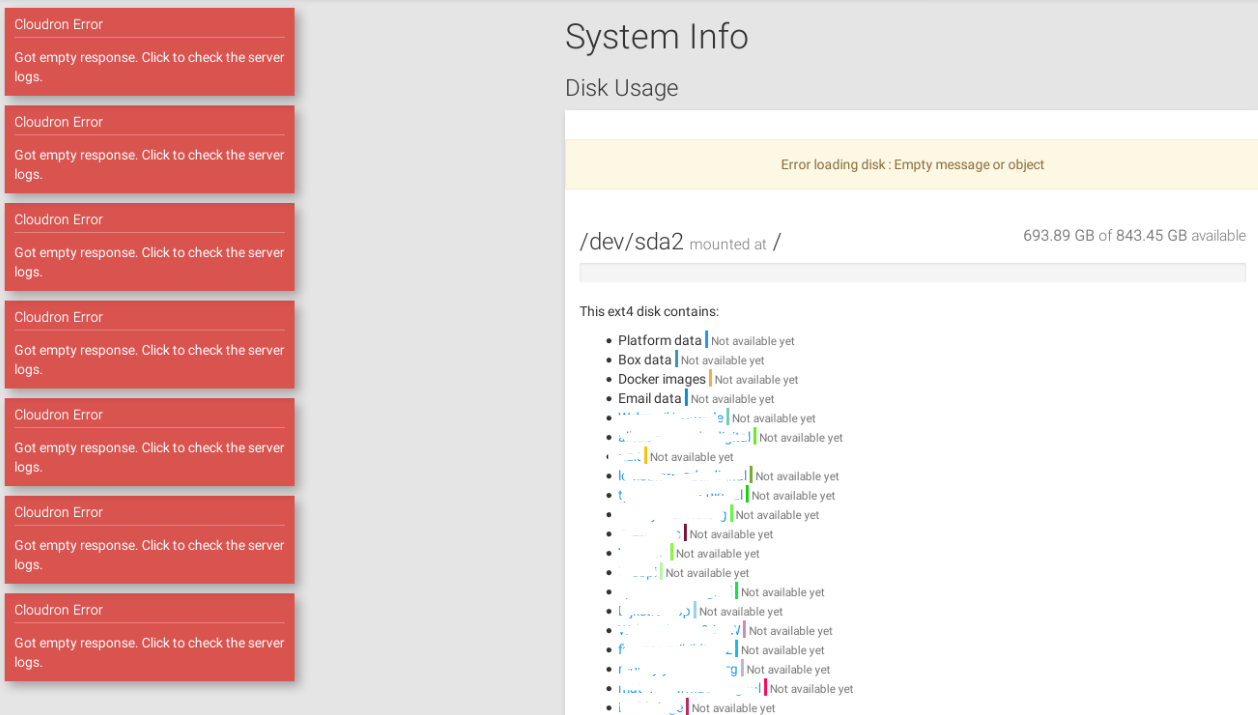
I clicked on an error box,there wasn't any error in the server log.
And in the console:
https://paste.cloudron.io/utococaruh.rbOn the same page, Services part was also wrong: the following services never stop from loading and don't show their status:
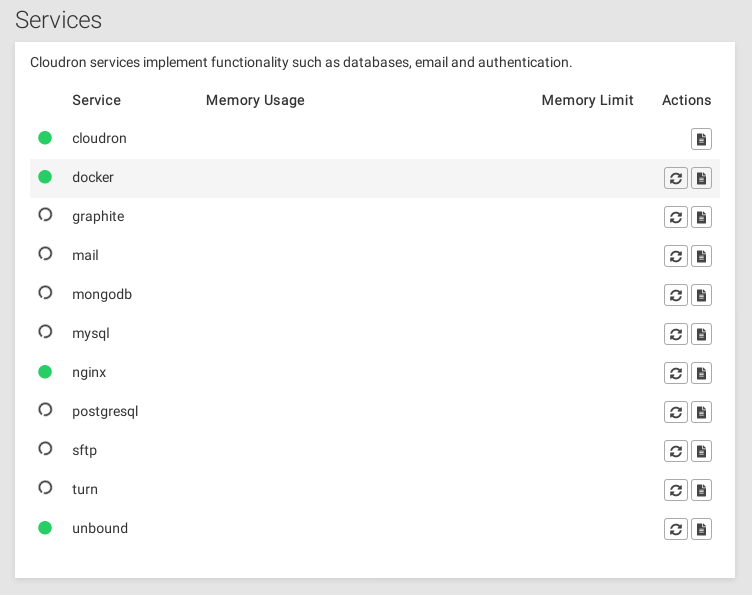
These issues stayed across several cloudron updates and a reboot.
What can I do to help you debug this?
(My SSH Support Access is enabled, in case you need it) -
FYI, I have the same errors:
I clicked on an error box,there wasn't any error in the server log.
And in the console:
https://paste.cloudron.io/utococaruh.rbOn the same page, Services part was also wrong: the following services never stop from loading and don't show their status:
These issues stayed across several cloudron updates and a reboot.
What can I do to help you debug this?
(My SSH Support Access is enabled, in case you need it)@ruihildt It might be worth creating your own post to troubleshoot that, because while you say it's the "same errors", it actually looks quite a bit different from what I reported. For example, I never once had any "Cloudron Error" message nor a message that stated "Error loading disk : Empty message or object". Your issue seems quite a bit different other than affecting the same page in the admin UI.

Hello! It looks like you're interested in this conversation, but you don't have an account yet.
Getting fed up of having to scroll through the same posts each visit? When you register for an account, you'll always come back to exactly where you were before, and choose to be notified of new replies (either via email, or push notification). You'll also be able to save bookmarks and upvote posts to show your appreciation to other community members.
With your input, this post could be even better 💗
Register Login