Shouldn't we get an alert when a service container fails / is unhealthy?

-
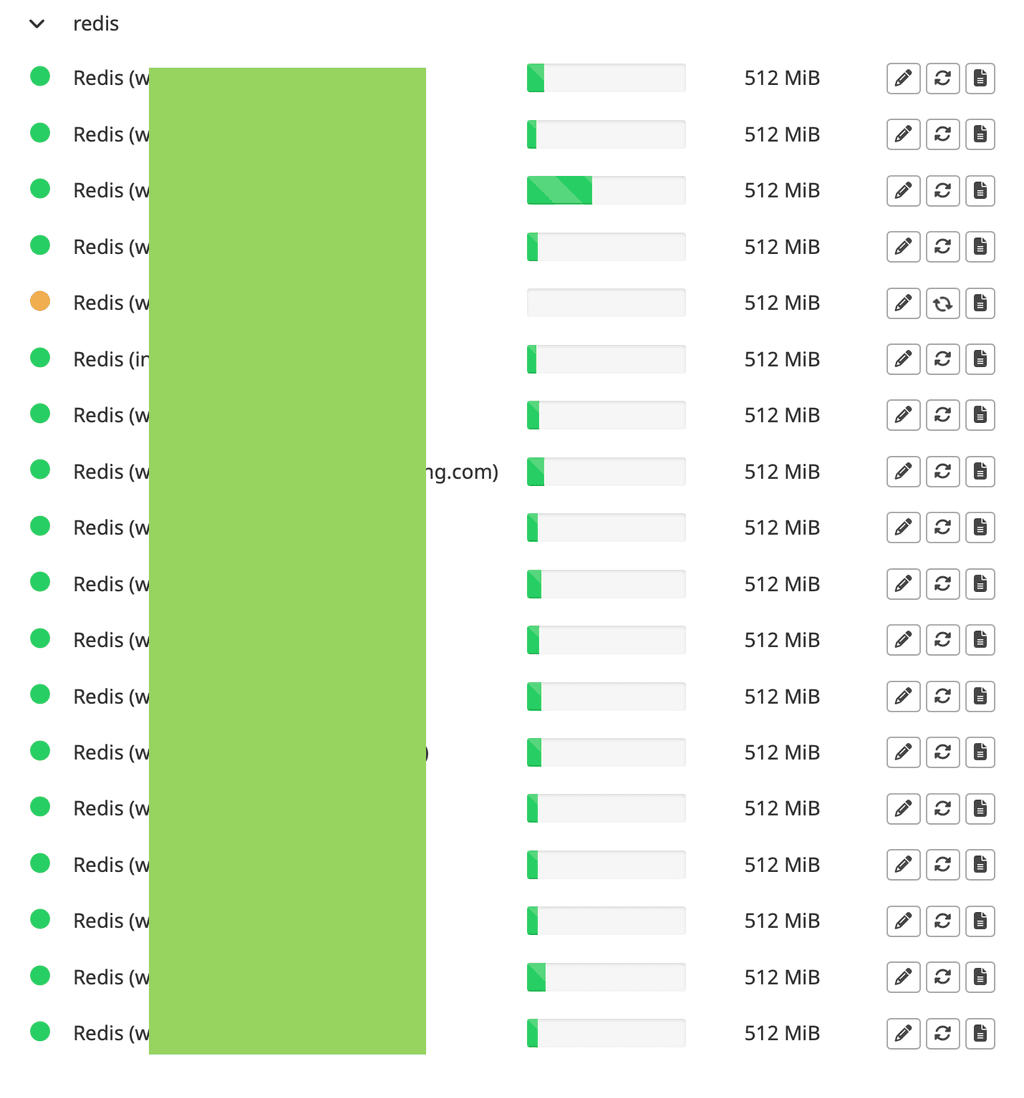
@girish , I appear to be running into the same issue again. I got an alert that my backup failed to "timedout", and when I checked the Services page it showed one redis instance orange instead of green. Restarting the redis container doesn't seem to do anything to resolve the issue. Things tend to look better when I restart docker entirely.
But even that isn't always enough. The logs show no issues for the redis container. And later on, a different redis container got the same issue. It's very odd. This is definitely a recent issue for me. Seems related to when I installed 8.3.1 but I'm not certain yet.
Logs look fine in the container:
Mar 24 22:16:03 ==> Starting supervisor
Mar 24 22:16:04 2025-03-25 05:16:04,052 INFO Included extra file "/etc/supervisor/conf.d/redis-service.conf" during parsing
Mar 24 22:16:04 2025-03-25 05:16:04,053 INFO Included extra file "/etc/supervisor/conf.d/redis.conf" during parsing
Mar 24 22:16:04 2025-03-25 05:16:04,053 INFO Set uid to user 0 succeeded
Mar 24 22:16:04 2025-03-25 05:16:04,059 INFO RPC interface 'supervisor' initialized
Mar 24 22:16:04 2025-03-25 05:16:04,059 CRIT Server 'inet_http_server' running without any HTTP authentication checking
Mar 24 22:16:04 2025-03-25 05:16:04,059 INFO supervisord started with pid 1
Mar 24 22:16:05 2025-03-25 05:16:05,061 INFO spawned: 'redis' with pid 13
Mar 24 22:16:05 2025-03-25 05:16:05,062 INFO spawned: 'redis-service' with pid 14
Mar 24 22:16:05 13:C 25 Mar 2025 05:16:05.092 # WARNING Memory overcommit must be enabled! Without it, a background save or replication may fail under low memory condition. Being disabled, it can also cause failures without low memory condition, see https://github.com/jemalloc/jemalloc/issues/1328. To fix this issue add 'vm.overcommit_memory = 1' to /etc/sysctl.conf and then reboot or run the command 'sysctl vm.overcommit_memory=1' for this to take effect.
Mar 24 22:16:05 13:C 25 Mar 2025 05:16:05.099 * oO0OoO0OoO0Oo Redis is starting oO0OoO0OoO0Oo
Mar 24 22:16:05 13:C 25 Mar 2025 05:16:05.099 * Redis version=7.4.2, bits=64, commit=00000000, modified=0, pid=13, just started
Mar 24 22:16:05 13:C 25 Mar 2025 05:16:05.099 * Configuration loaded
Mar 24 22:16:05 13:M 25 Mar 2025 05:16:05.099 * monotonic clock: POSIX clock_gettime
Mar 24 22:16:05 13:M 25 Mar 2025 05:16:05.105 # Failed to write PID file: Permission denied
Mar 24 22:16:05 13:M 25 Mar 2025 05:16:05.105 * Running mode=standalone, port=6379.
Mar 24 22:16:05 13:M 25 Mar 2025 05:16:05.106 * Server initialized
Mar 24 22:16:05 13:M 25 Mar 2025 05:16:05.106 * Loading RDB produced by version 7.4.2
Mar 24 22:16:05 13:M 25 Mar 2025 05:16:05.106 * RDB age 169 seconds
Mar 24 22:16:05 13:M 25 Mar 2025 05:16:05.106 * RDB memory usage when created 3.71 Mb
Mar 24 22:16:05 13:M 25 Mar 2025 05:16:05.130 * Done loading RDB, keys loaded: 7119, keys expired: 0.
Mar 24 22:16:05 13:M 25 Mar 2025 05:16:05.130 * DB loaded from disk: 0.024 seconds
Mar 24 22:16:05 13:M 25 Mar 2025 05:16:05.130 * Ready to accept connections tcp
Mar 24 22:16:05 Redis service endpoint listening on http://:::3000
Mar 24 22:16:06 2025-03-25 05:16:06,473 INFO success: redis entered RUNNING state, process has stayed up for > than 1 seconds (startsecs)
Mar 24 22:16:06 2025-03-25 05:16:06,474 INFO success: redis-service entered RUNNING state, process has stayed up for > than 1 seconds (startsecs)
Mar 24 22:21:06 13:M 25 Mar 2025 05:21:06.032 * 10 changes in 300 seconds. Saving...
Mar 24 22:21:06 13:M 25 Mar 2025 05:21:06.032 * Background saving started by pid 26
Mar 24 22:21:06 26:C 25 Mar 2025 05:21:06.049 * DB saved on disk
Mar 24 22:21:06 26:C 25 Mar 2025 05:21:06.049 * Fork CoW for RDB: current 1 MB, peak 1 MB, average 0 MB
Mar 24 22:21:06 13:M 25 Mar 2025 05:21:06.132 * Background saving terminated with success
Mar 24 22:26:07 13:M 25 Mar 2025 05:26:07.054 * 10 changes in 300 seconds. Saving...
Mar 24 22:26:07 13:M 25 Mar 2025 05:26:07.055 * Background saving started by pid 27
Mar 24 22:26:07 27:C 25 Mar 2025 05:26:07.073 * DB saved on disk
Mar 24 22:26:07 27:C 25 Mar 2025 05:26:07.073 * Fork CoW for RDB: current 1 MB, peak 1 MB, average 0 MB
Mar 24 22:26:07 13:M 25 Mar 2025 05:26:07.155 * Background saving terminated with success
Notice that it's listening and ready for connections. However one thing I notice between a container in this state and the green ones is the lack of health check access logs for it. On a working one for example, I see this:
Mar 24 22:16:03 ==> Starting supervisor
Mar 24 22:16:04 2025-03-25 05:16:04,123 INFO Included extra file "/etc/supervisor/conf.d/redis-service.conf" during parsing
Mar 24 22:16:04 2025-03-25 05:16:04,124 INFO Included extra file "/etc/supervisor/conf.d/redis.conf" during parsing
Mar 24 22:16:04 2025-03-25 05:16:04,124 INFO Set uid to user 0 succeeded
Mar 24 22:16:04 2025-03-25 05:16:04,128 INFO RPC interface 'supervisor' initialized
Mar 24 22:16:04 2025-03-25 05:16:04,129 CRIT Server 'inet_http_server' running without any HTTP authentication checking
Mar 24 22:16:04 2025-03-25 05:16:04,129 INFO supervisord started with pid 1
Mar 24 22:16:05 2025-03-25 05:16:05,130 INFO spawned: 'redis' with pid 12
Mar 24 22:16:05 2025-03-25 05:16:05,132 INFO spawned: 'redis-service' with pid 13
Mar 24 22:16:05 12:C 25 Mar 2025 05:16:05.138 # WARNING Memory overcommit must be enabled! Without it, a background save or replication may fail under low memory condition. Being disabled, it can also cause failures without low memory condition, see https://github.com/jemalloc/jemalloc/issues/1328. To fix this issue add 'vm.overcommit_memory = 1' to /etc/sysctl.conf and then reboot or run the command 'sysctl vm.overcommit_memory=1' for this to take effect.
Mar 24 22:16:05 12:C 25 Mar 2025 05:16:05.138 * oO0OoO0OoO0Oo Redis is starting oO0OoO0OoO0Oo
Mar 24 22:16:05 12:C 25 Mar 2025 05:16:05.138 * Redis version=7.4.2, bits=64, commit=00000000, modified=0, pid=12, just started
Mar 24 22:16:05 12:C 25 Mar 2025 05:16:05.138 * Configuration loaded
Mar 24 22:16:05 12:M 25 Mar 2025 05:16:05.138 * monotonic clock: POSIX clock_gettime
Mar 24 22:16:05 12:M 25 Mar 2025 05:16:05.139 # Failed to write PID file: Permission denied
Mar 24 22:16:05 12:M 25 Mar 2025 05:16:05.139 * Running mode=standalone, port=6379.
Mar 24 22:16:05 12:M 25 Mar 2025 05:16:05.140 * Server initialized
Mar 24 22:16:05 12:M 25 Mar 2025 05:16:05.140 * Loading RDB produced by version 7.4.2
Mar 24 22:16:05 12:M 25 Mar 2025 05:16:05.140 * RDB age 170 seconds
Mar 24 22:16:05 12:M 25 Mar 2025 05:16:05.140 * RDB memory usage when created 10.12 Mb
Mar 24 22:16:05 12:M 25 Mar 2025 05:16:05.231 * Done loading RDB, keys loaded: 28836, keys expired: 0.
Mar 24 22:16:05 12:M 25 Mar 2025 05:16:05.231 * DB loaded from disk: 0.091 seconds
Mar 24 22:16:05 12:M 25 Mar 2025 05:16:05.231 * Ready to accept connections tcp
Mar 24 22:16:05 Redis service endpoint listening on http://:::3000
Mar 24 22:16:06 2025-03-25 05:16:06,477 INFO success: redis entered RUNNING state, process has stayed up for > than 1 seconds (startsecs)
Mar 24 22:16:06 2025-03-25 05:16:06,481 INFO success: redis-service entered RUNNING state, process has stayed up for > than 1 seconds (startsecs)
Mar 24 22:19:39 [GET] /healthcheck
Mar 24 22:21:06 12:M 25 Mar 2025 05:21:06.083 * 10 changes in 300 seconds. Saving...
Mar 24 22:21:06 12:M 25 Mar 2025 05:21:06.083 * Background saving started by pid 30
Mar 24 22:21:06 30:C 25 Mar 2025 05:21:06.148 * DB saved on disk
Mar 24 22:21:06 30:C 25 Mar 2025 05:21:06.149 * Fork CoW for RDB: current 1 MB, peak 1 MB, average 0 MB
Mar 24 22:21:06 12:M 25 Mar 2025 05:21:06.183 * Background saving terminated with success
Mar 24 22:26:07 12:M 25 Mar 2025 05:26:07.060 * 10 changes in 300 seconds. Saving...
Mar 24 22:26:07 12:M 25 Mar 2025 05:26:07.061 * Background saving started by pid 31
Mar 24 22:26:07 31:C 25 Mar 2025 05:26:07.124 * DB saved on disk
Mar 24 22:26:07 31:C 25 Mar 2025 05:26:07.125 * Fork CoW for RDB: current 1 MB, peak 1 MB, average 0 MB
Mar 24 22:26:07 12:M 25 Mar 2025 05:26:07.161 * Background saving terminated with success
Here's what it looks like in the UI:
-
I also face similar issues, with apps such as WordPress or Shaarli, which sometimes stop responding to requests, yet do not crash but appear unhealthy to Cloudron or to any monitoring tool. It become annoying to need to restart apps manually several times a week, to the point I had to script something to fix the missing monitoring / autorestart for the more fragile apps running on Cloudron. As discussed in some thread in Cloudron forum this kind of healthcheck must be part of the Cloudron platform ideally. See -> https://forum.cloudron.io/post/101225 for the thread I mentioned and the mitigation (script) I'm using.
-
At this point it might make sense to upgrade Redis to KeyDB a faster Redis Alternative and use one instance for all apps, like we do for Postgres.
No need to have 10s of instances.
-
When this happens again, can you check
dmesg? Do you see any OOM messages? I can't think of a reason why those redis instances go down otherwise.@girish No OOM errors seen. They often barely get close to the memory limit too. It's usually only about 15-30% usage for the memory for the redis containers.
I looked at
dmesgbut do not see anything yet. I'll take a look when It happens again.Interestingly though, I do see a similar issue with the Graphite service too which I filed a separate report for in case they're different. The main difference to me is that it doesn't block the backup process so it's less of a blocker for me at the moment, but something that should still get resolved.
-
Hi @girish , I'm still having this issue intermittently, but the logs really don't seem to suggest anything. When these services become affected, it causes the backups to fail which is very concerning.
Right now, the logs don't seem to show anything. Here's the latest affected redis instance (it rotates around by the way, it is random which redis container seems to get impacted):
Apr 02 17:37:36 ==> Starting supervisor
Apr 02 17:37:36 2025-04-03 00:37:36,731 INFO Included extra file "/etc/supervisor/conf.d/redis-service.conf" during parsing
Apr 02 17:37:36 2025-04-03 00:37:36,731 INFO Included extra file "/etc/supervisor/conf.d/redis.conf" during parsing
Apr 02 17:37:36 2025-04-03 00:37:36,731 INFO Set uid to user 0 succeeded
Apr 02 17:37:36 2025-04-03 00:37:36,734 INFO RPC interface 'supervisor' initialized
Apr 02 17:37:36 2025-04-03 00:37:36,734 CRIT Server 'inet_http_server' running without any HTTP authentication checking
Apr 02 17:37:36 2025-04-03 00:37:36,734 INFO supervisord started with pid 1
Apr 02 17:37:37 2025-04-03 00:37:37,736 INFO spawned: 'redis' with pid 13
Apr 02 17:37:37 2025-04-03 00:37:37,736 INFO spawned: 'redis-service' with pid 14
Apr 02 17:37:37 13:C 03 Apr 2025 00:37:37.741 # WARNING Memory overcommit must be enabled! Without it, a background save or replication may fail under low memory condition. Being disabled, it can also cause failures without low memory condition, see https://github.com/jemalloc/jemalloc/issues/1328. To fix this issue add 'vm.overcommit_memory = 1' to /etc/sysctl.conf and then reboot or run the command 'sysctl vm.overcommit_memory=1' for this to take effect.
Apr 02 17:37:37 13:C 03 Apr 2025 00:37:37.741 * oO0OoO0OoO0Oo Redis is starting oO0OoO0OoO0Oo
Apr 02 17:37:37 13:C 03 Apr 2025 00:37:37.741 * Redis version=7.4.2, bits=64, commit=00000000, modified=0, pid=13, just started
Apr 02 17:37:37 13:C 03 Apr 2025 00:37:37.741 * Configuration loaded
Apr 02 17:37:37 13:M 03 Apr 2025 00:37:37.741 * monotonic clock: POSIX clock_gettime
Apr 02 17:37:37 13:M 03 Apr 2025 00:37:37.742 # Failed to write PID file: Permission denied
Apr 02 17:37:37 13:M 03 Apr 2025 00:37:37.742 * Running mode=standalone, port=6379.
Apr 02 17:37:37 13:M 03 Apr 2025 00:37:37.742 * Server initialized
Apr 02 17:37:37 13:M 03 Apr 2025 00:37:37.742 * Loading RDB produced by version 7.4.2
Apr 02 17:37:37 13:M 03 Apr 2025 00:37:37.742 * RDB age 1 seconds
Apr 02 17:37:37 13:M 03 Apr 2025 00:37:37.742 * RDB memory usage when created 2.08 Mb
Apr 02 17:37:37 13:M 03 Apr 2025 00:37:37.744 * Done loading RDB, keys loaded: 1513, keys expired: 0.
Apr 02 17:37:37 13:M 03 Apr 2025 00:37:37.744 * DB loaded from disk: 0.003 seconds
Apr 02 17:37:37 13:M 03 Apr 2025 00:37:37.744 * Ready to accept connections tcp
Apr 02 17:37:37 Redis service endpoint listening on http://:::3000
Apr 02 17:37:38 2025-04-03 00:37:38,802 INFO success: redis entered RUNNING state, process has stayed up for > than 1 seconds (startsecs)
Apr 02 17:37:38 2025-04-03 00:37:38,802 INFO success: redis-service entered RUNNING state, process has stayed up for > than 1 seconds (startsecs)
Apr 02 17:42:14 2025-04-03 00:42:14,099 WARN received SIGTERM indicating exit request
Apr 02 17:42:14 2025-04-03 00:42:14,099 INFO waiting for redis, redis-service to die
Apr 02 17:42:14 2025-04-03 00:42:14,101 WARN stopped: redis-service (terminated by SIGTERM)
Apr 02 17:42:14 13:signal-handler (1743640934) Received SIGTERM scheduling shutdown...
Apr 02 17:42:14 13:M 03 Apr 2025 00:42:14.177 * User requested shutdown...
Apr 02 17:42:14 13:M 03 Apr 2025 00:42:14.177 * Saving the final RDB snapshot before exiting.
Apr 02 17:42:14 13:M 03 Apr 2025 00:42:14.185 * DB saved on disk
Apr 02 17:42:14 13:M 03 Apr 2025 00:42:14.185 * Removing the pid file.
Apr 02 17:42:14 13:M 03 Apr 2025 00:42:14.185 # Redis is now ready to exit, bye bye...
Apr 02 17:42:14 2025-04-03 00:42:14,186 INFO stopped: redis (exit status 0)
Apr 02 17:42:28 ==> Starting supervisor
Apr 02 17:42:28 2025-04-03 00:42:28,750 INFO Included extra file "/etc/supervisor/conf.d/redis-service.conf" during parsing
Apr 02 17:42:28 2025-04-03 00:42:28,750 INFO Included extra file "/etc/supervisor/conf.d/redis.conf" during parsing
Apr 02 17:42:28 2025-04-03 00:42:28,750 INFO Set uid to user 0 succeeded
Apr 02 17:42:28 2025-04-03 00:42:28,756 INFO RPC interface 'supervisor' initialized
Apr 02 17:42:28 2025-04-03 00:42:28,756 CRIT Server 'inet_http_server' running without any HTTP authentication checking
Apr 02 17:42:28 2025-04-03 00:42:28,756 INFO supervisord started with pid 1
Apr 02 17:42:29 2025-04-03 00:42:29,759 INFO spawned: 'redis' with pid 13
Apr 02 17:42:29 2025-04-03 00:42:29,761 INFO spawned: 'redis-service' with pid 14
Apr 02 17:42:29 13:C 03 Apr 2025 00:42:29.779 # WARNING Memory overcommit must be enabled! Without it, a background save or replication may fail under low memory condition. Being disabled, it can also cause failures without low memory condition, see https://github.com/jemalloc/jemalloc/issues/1328. To fix this issue add 'vm.overcommit_memory = 1' to /etc/sysctl.conf and then reboot or run the command 'sysctl vm.overcommit_memory=1' for this to take effect.
Apr 02 17:42:29 13:C 03 Apr 2025 00:42:29.779 * oO0OoO0OoO0Oo Redis is starting oO0OoO0OoO0Oo
Apr 02 17:42:29 13:C 03 Apr 2025 00:42:29.779 * Redis version=7.4.2, bits=64, commit=00000000, modified=0, pid=13, just started
Apr 02 17:42:29 13:C 03 Apr 2025 00:42:29.779 * Configuration loaded
Apr 02 17:42:29 13:M 03 Apr 2025 00:42:29.779 * monotonic clock: POSIX clock_gettime
Apr 02 17:42:29 13:M 03 Apr 2025 00:42:29.780 # Failed to write PID file: Permission denied
Apr 02 17:42:29 13:M 03 Apr 2025 00:42:29.780 * Running mode=standalone, port=6379.
Apr 02 17:42:29 13:M 03 Apr 2025 00:42:29.780 * Server initialized
Apr 02 17:42:29 13:M 03 Apr 2025 00:42:29.780 * Loading RDB produced by version 7.4.2
Apr 02 17:42:29 13:M 03 Apr 2025 00:42:29.780 * RDB age 15 seconds
Apr 02 17:42:29 13:M 03 Apr 2025 00:42:29.780 * RDB memory usage when created 2.10 Mb
Apr 02 17:42:29 13:M 03 Apr 2025 00:42:29.785 * Done loading RDB, keys loaded: 1513, keys expired: 0.
Apr 02 17:42:29 13:M 03 Apr 2025 00:42:29.785 * DB loaded from disk: 0.005 seconds
Apr 02 17:42:29 13:M 03 Apr 2025 00:42:29.785 * Ready to accept connections tcp
Apr 02 17:42:29 Redis service endpoint listening on http://:::3000
Apr 02 17:42:30 2025-04-03 00:42:30,863 INFO success: redis entered RUNNING state, process has stayed up for > than 1 seconds (startsecs)
Apr 02 17:42:30 2025-04-03 00:42:30,863 INFO success: redis-service entered RUNNING state, process has stayed up for > than 1 seconds (startsecs)
Apr 02 17:42:32 [GET] /healthcheck
Apr 02 17:42:33 [GET] /healthcheck
Apr 02 17:42:38 [GET] /healthcheck
Apr 02 17:42:45 [GET] /healthcheck
Apr 02 17:42:56 [GET] /healthcheck
Apr 02 17:47:28 [GET] /healthcheck
Apr 02 17:47:30 13:M 03 Apr 2025 00:47:30.072 * 10 changes in 300 seconds. Saving...
Apr 02 17:47:30 13:M 03 Apr 2025 00:47:30.072 * Background saving started by pid 56
Apr 02 17:47:30 56:C 03 Apr 2025 00:47:30.079 * DB saved on disk
Apr 02 17:47:30 56:C 03 Apr 2025 00:47:30.080 * Fork CoW for RDB: current 1 MB, peak 1 MB, average 0 MB
Apr 02 17:47:30 13:M 03 Apr 2025 00:47:30.172 * Background saving terminated with success
Apr 02 17:47:34 [GET] /healthcheck
Apr 02 17:47:40 [GET] /healthcheck
Apr 02 17:47:45 [GET] /healthcheck
Apr 02 17:48:21 [POST] /backup
Apr 02 17:48:21 backing up
Apr 02 17:48:21 13:M 03 Apr 2025 00:48:21.512 * DB saved on disk
Apr 02 17:48:45 [GET] /healthcheck
The only thing I can do to temporarily get it into a good state is restart the Docker service, and I often need to do that a few times before it really becomes stable.
The dmesg output I captured for you and put it here (it was too long to put into this post): https://paste.cloudron.io/raw/utedesasid
I hope that helps. Some of the data is redacted in the public view of it just to be cautious, but I have the original file un-redacted if you need it and I can email it to you too.
For the backup failure part, in case that helps show context...
Apr 02 14:05:34 box:services backupAddons Apr 02 14:05:34 box:services backupAddons: backing up ["mysql","oidc","localstorage","sendmail","scheduler","redis"] Apr 02 14:05:34 box:services Backing up mysql Apr 02 14:05:34 box:services pipeRequestToFile: connected with status code 200 Apr 02 14:05:34 box:services Backing up redis Apr 02 14:05:39 box:services pipeRequestToFile: timeout - connect or post-connect idle timeout Apr 02 14:05:39 box:backuptask fullBackup: app <domain> backup finished. Took 5.129 seconds Apr 02 14:05:39 box:locks write: current locks: {"backup_task":null} Apr 02 14:05:39 box:locks release: app_6120f84a-0953-4982-9167-ef872c0ee49a Apr 02 14:05:39 box:taskworker Task took 339.377 seconds Apr 02 14:05:39 box:tasks setCompleted - 28833: {"result":null,"error":{"stack":"Error: Request timedout\n at ClientRequest.<anonymous> (/home/yellowtent/box/src/services.js:1347:20)\n at Object.onceWrapper (node:events:633:28)\n at ClientRequest.emit (node:events:519:28)\n at ClientRequest.emit (node:domain:488:12)\n at Socket.emitRequestTimeout (node:_http_client:849:9)\n at Object.onceWrapper (node:events:633:28)\n at Socket.emit (node:events:531:35)\n at Socket.emit (node:domain:488:12)\n at Socket._onTimeout (node:net:591:8)\n at listOnTimeout (node:internal/timers:581:17)","message":"Request timedout"}} Apr 02 14:05:39 box:tasks update 28833: {"percent":100,"result":null,"error":{"stack":"Error: Request timedout\n at ClientRequest.<anonymous> (/home/yellowtent/box/src/services.js:1347:20)\n at Object.onceWrapper (node:events:633:28)\n at ClientRequest.emit (node:events:519:28)\n at ClientRequest.emit (node:domain:488:12)\n at Socket.emitRequestTimeout (node:_http_client:849:9)\n at Object.onceWrapper (node:events:633:28)\n at Socket.emit (node:events:531:35)\n at Socket.emit (node:domain:488:12)\n at Socket._onTimeout (node:net:591:8)\n at listOnTimeout (node:internal/timers:581:17)","message":"Request timedout"}} Apr 02 14:05:39 Error: Request timedout Apr 02 14:05:39 at ClientRequest.<anonymous> (/home/yellowtent/box/src/services.js:1347:20) Apr 02 14:05:39 at Object.onceWrapper (node:events:633:28) Apr 02 14:05:39 at ClientRequest.emit (node:events:519:28) Apr 02 14:05:39 at ClientRequest.emit (node:domain:488:12) Apr 02 14:05:39 at Socket.emitRequestTimeout (node:_http_client:849:9) Apr 02 14:05:39 at Object.onceWrapper (node:events:633:28) Apr 02 14:05:39 at Socket.emit (node:events:531:35) Apr 02 14:05:39 at Socket.emit (node:domain:488:12) Apr 02 14:05:39 at Socket._onTimeout (node:net:591:8) Apr 02 14:05:39 at listOnTimeout (node:internal/timers:581:17) -
Is always the same redis instance affected with this? That would help narrow down the issue.
Also if this happens again, can you restart the redis process within its docker container maybe via SSH and:
docker exec -ti <rediscontainerid> /bin/bash supervisorctl restart redis-service # this would be service process facilitating backups and all # check if things work now # otherwise try also supervisorctl restart redis # the actual redis process inside the container -
Is always the same redis instance affected with this? That would help narrow down the issue.
Also if this happens again, can you restart the redis process within its docker container maybe via SSH and:
docker exec -ti <rediscontainerid> /bin/bash supervisorctl restart redis-service # this would be service process facilitating backups and all # check if things work now # otherwise try also supervisorctl restart redis # the actual redis process inside the container@nebulon I'm not sure how to tell which redis container is the culprit. The Cloudron Services page shows which one, but there's no container ID associated with it from the UI that I can find. And in the
docker pscommand, everything shows "up 22 hours" for example, nothing looks wrong from that list. Is there a way to know which one to exec into?Edit: Sorry, I figured it out. Looking at the logs of the affected container shows the container name.

-
Is always the same redis instance affected with this? That would help narrow down the issue.
Also if this happens again, can you restart the redis process within its docker container maybe via SSH and:
docker exec -ti <rediscontainerid> /bin/bash supervisorctl restart redis-service # this would be service process facilitating backups and all # check if things work now # otherwise try also supervisorctl restart redis # the actual redis process inside the container@nebulon - tl;dr = The commands didn't change the behaviour at all, it was still causing backups to fail and Services page showed it as orange still.
--
When I restart the service affected (redis in this case) by exec'ing into the container and running
supervisorctl restart redis-service, it doesn't solve the problem. It still suggests that redis is restarting correctly as the output shows the following:root@redis-<UUID>:/app/code# supervisorctl restart redis-service redis-service: stopped redis-service: startedAnd the container logs show the following:
Apr 03 19:35:53 2025-04-04 02:35:53,254 INFO waiting for redis-service to stop
Apr 03 19:35:53 2025-04-04 02:35:53,256 WARN stopped: redis-service (terminated by SIGTERM)
Apr 03 19:35:53 2025-04-04 02:35:53,258 INFO spawned: 'redis-service' with pid 321
Apr 03 19:35:53 Redis service endpoint listening on http://:::3000
Apr 03 19:35:54 2025-04-04 02:35:54,320 INFO success: redis-service entered RUNNING state, process has stayed up for > than 1 seconds (startsecs)
However the services list still shows yellow and the backups continue to fail.
If I try with the following:
root@redis-<UUID>:/app/code# supervisorctl restart redis
redis: stopped
redis: started
It's the same behaviour, however I do see a little more in the logs for the container:
Apr 03 19:40:08 2025-04-04 02:40:08,186 INFO waiting for redis to stop
Apr 03 19:40:08 330:signal-handler (1743734408) Received SIGTERM scheduling shutdown...
Apr 03 19:40:08 330:M 04 Apr 2025 02:40:08.208 * User requested shutdown...
Apr 03 19:40:08 330:M 04 Apr 2025 02:40:08.208 * Saving the final RDB snapshot before exiting.
Apr 03 19:40:08 330:M 04 Apr 2025 02:40:08.216 * DB saved on disk
Apr 03 19:40:08 330:M 04 Apr 2025 02:40:08.216 * Removing the pid file.
Apr 03 19:40:08 330:M 04 Apr 2025 02:40:08.216 # Redis is now ready to exit, bye bye...
Apr 03 19:40:08 2025-04-04 02:40:08,218 INFO stopped: redis (exit status 0)
Apr 03 19:40:08 2025-04-04 02:40:08,220 INFO spawned: 'redis' with pid 337
Apr 03 19:40:08 337:C 04 Apr 2025 02:40:08.225 # WARNING Memory overcommit must be enabled! Without it, a background save or replication may fail under low memory condition. Being disabled, it can also cause failures without low memory condition, see https://github.com/jemalloc/jemalloc/issues/1328. To fix this issue add 'vm.overcommit_memory = 1' to /etc/sysctl.conf and then reboot or run the command 'sysctl vm.overcommit_memory=1' for this to take effect.
Apr 03 19:40:08 337:C 04 Apr 2025 02:40:08.225 * oO0OoO0OoO0Oo Redis is starting oO0OoO0OoO0Oo
Apr 03 19:40:08 337:C 04 Apr 2025 02:40:08.225 * Redis version=7.4.2, bits=64, commit=00000000, modified=0, pid=337, just started
Apr 03 19:40:08 337:C 04 Apr 2025 02:40:08.225 * Configuration loaded
Apr 03 19:40:08 337:M 04 Apr 2025 02:40:08.225 * monotonic clock: POSIX clock_gettime
Apr 03 19:40:08 337:M 04 Apr 2025 02:40:08.226 # Failed to write PID file: Permission denied
Apr 03 19:40:08 337:M 04 Apr 2025 02:40:08.226 * Running mode=standalone, port=6379.
Apr 03 19:40:08 337:M 04 Apr 2025 02:40:08.226 * Server initialized
Apr 03 19:40:08 337:M 04 Apr 2025 02:40:08.226 * Loading RDB produced by version 7.4.2
Apr 03 19:40:08 337:M 04 Apr 2025 02:40:08.226 * RDB age 0 seconds
Apr 03 19:40:08 337:M 04 Apr 2025 02:40:08.226 * RDB memory usage when created 2.70 Mb
Apr 03 19:40:08 337:M 04 Apr 2025 02:40:08.230 * Done loading RDB, keys loaded: 2177, keys expired: 0.
Apr 03 19:40:08 337:M 04 Apr 2025 02:40:08.230 * DB loaded from disk: 0.004 seconds
Apr 03 19:40:08 337:M 04 Apr 2025 02:40:08.230 * Ready to accept connections tcp
Apr 03 19:40:09 2025-04-04 02:40:09,231 INFO success: redis entered RUNNING state, process has stayed up for > than 1 seconds (startsecs)
What I was able to do though temporarily to get this to work is restart the docker service entirely, but of course this method tends to cause a little bit of downtime. This should be stable until the next time I need to restart my server for security updates, I suspect, but this really needs to get figured out. If nobody else is seeing this, perhaps it's something unique to my server? I did upgrade to Ubuntu 24.04 a few weeks ago but at the same time I also upgraded to the latest Cloudron version too, so it's hard to know if either of those or which one (if at all) is possibly related to the issue, but something to keep in mind in case you think these are related at all.
What else can we try?
-
Not sure if this is related or not, but I noticed when I SSH'd into my server, and I noticed there was mention of a zombie process. I ran this and found it was node... I know Cloudron runs on node... is this possibly related at all?
ubuntu@my:~$ ps aux | grep Z USER PID %CPU %MEM VSZ RSS TTY STAT START TIME COMMAND ubuntu 1999826 0.0 0.0 0 0 ? Zs 03:25 0:00 [node] <defunct> -
Alright thanks for the debugging. I think the next step to test when you hit this situation, is to see if you can curl the healthcheck manually within the container, since all services within seem fine, so maybe it is a docker network issue then.
You can find the ip using
docker psanddocker inspect <rediscontainer>:curl -v http://<rediscontainerIP>:3000/healthcheck -
Alright thanks for the debugging. I think the next step to test when you hit this situation, is to see if you can curl the healthcheck manually within the container, since all services within seem fine, so maybe it is a docker network issue then.
You can find the ip using
docker psanddocker inspect <rediscontainer>:curl -v http://<rediscontainerIP>:3000/healthcheck@nebulon Okay I see the following when I run that healthcheck GET with the current yellow light causing issues again which is blocking the backup process. It does indeed seem like a possible connection issue:
root@my:~# curl -v http://172.18.0.4:3000/healthcheck
*   Trying 172.18.0.4:3000...
* connect to 172.18.0.4 port 3000 from 172.18.0.1 port 44402 failed: Connection timed out
* Failed to connect to 172.18.0.4 port 3000 after 135822 ms: Couldn't connect to server
* Closing connection
curl: (28) Failed to connect to 172.18.0.4 port 3000 after 135822 ms: Couldn't connect to server
When I use a working redis instance showing the green lights, then I get the expected response:
root@my:~# curl -v http://172.18.0.7:3000/healthcheck
*   Trying 172.18.0.7:3000...
* Connected to 172.18.0.7 (172.18.0.7) port 3000
> GET /healthcheck HTTP/1.1
> Host: 172.18.0.7:3000
> User-Agent: curl/8.5.0
> Accept: */*
>
< HTTP/1.1 401 Unauthorized
< X-Powered-By: Express
< Content-Type: application/json; charset=utf-8
< Content-Length: 2
< ETag: W/"2-vyGp6PvFo4RvsFtPoIWeCReyIC8"
< Date: Thu, 17 Apr 2025 18:43:37 GMT
< Connection: keep-alive
< Keep-Alive: timeout=5
<
* Connection #0 to host 172.18.0.7 left intact
Any recommendations? I've never had the frequency of these issues before until the past month or two, and not sure why this is happening. Unclear if this is something in my environment (it seems like maybe others are not seeing this issue), or if it's a Cloudron thing. Certainly open to this maybe being an issue in my environment only, just not sure what to try next.
-
@nebulon / @girish , is there a possibility that this is related to https://forum.cloudron.io/post/103522 at all? I wouldn't think so since this seems to be intermittent and only affecting one container at a time (usually redis it seems)... but wanted to make sure you were aware just in case this is the root cause.
-
This seems like a port binding issue or Docker network issue somehow, because the health check GET requests work successfully for any working containers, but the non-working containers timeout. However when inside the non-working container, the health check (if using localhost) works fine, so redis is working and everything seems to be running successfully, the issue appears to be more that it can't be accessed for some reason from the host.
-
When I exec into the working container and run the health-check to the broken container, it succeeds. So this definitely confirms to me that the issue is somewhere from the host network to container, where-as container-to-container works perfectly fine.
From the working container to the non-working container:
root@redis-2e36b3e8-22d9-477c-bd56-d2c284909932:/app/code# curl -v http://172.18.0.2:3000/healthcheck
*   Trying 172.18.0.2:3000...
* Connected to 172.18.0.2 (172.18.0.2) port 3000
> GET /healthcheck HTTP/1.1
> Host: 172.18.0.2:3000
> User-Agent: curl/8.5.0
> Accept: */*
>
< HTTP/1.1 401 Unauthorized
< X-Powered-By: Express
< Content-Type: application/json; charset=utf-8
< Content-Length: 2
< ETag: W/"2-vyGp6PvFo4RvsFtPoIWeCReyIC8"
< Date: Fri, 18 Apr 2025 05:24:05 GMT
< Connection: keep-alive
< Keep-Alive: timeout=5
<
* Connection #0 to host 172.18.0.2 left intact
From the non-working container to the working container:
root@redis-00895422-a1ff-4196-8bb8-cb4ff8d6eeaa:/app/code# curl -v http://172.18.0.3:3000/healthcheck
*   Trying 172.18.0.3:3000...
* Connected to 172.18.0.3 (172.18.0.3) port 3000
> GET /healthcheck HTTP/1.1
> Host: 172.18.0.3:3000
> User-Agent: curl/8.5.0
> Accept: */*
>
< HTTP/1.1 401 Unauthorized
< X-Powered-By: Express
< Content-Type: application/json; charset=utf-8
< Content-Length: 2
< ETag: W/"2-vyGp6PvFo4RvsFtPoIWeCReyIC8"
< Date: Fri, 18 Apr 2025 05:25:40 GMT
< Connection: keep-alive
< Keep-Alive: timeout=5
<
* Connection #0 to host 172.18.0.3 left intact
But from host to working redis and non-working redis shows results above at https://forum.cloudron.io/post/105899
-
OMG I think I figured it out and I'm really kicking myself. I threw a bunch of logs from Cloudron into ChatGPT for review, and it highlighted a line in the logs:
2025-04-13T01:02:17.357Z box:shell network /usr/bin/sudo -S /home/yellowtent/box/src/scripts/setblocklist.shI believe this is from the ipblocklist workflow I implemented based on https://docs.cloudron.io/guides/community/blocklist-updates/. I took a look at the IP address concatenation and sure enough it includes the two IP addresses of 172.18.0.2 and 172.18.0.4, which represent the two redis containers currently failing. I think this explains why this is happening, so it was basically the result of these IPs somehow making it onto the blocklist from firehol lists. Going to determine which list specifically added it so I can remove it from my IP blocklists I guess. As soon as I cleared the IP blocklist in Cloudron, everything worked immediately.
")
Sorry for the blast of comments, but figured it may help others who run into similar issues.
I'm just glad we sorted it out. -
Thanks for sharing your journey towards a luckly simple fix in the end! Good to keep the blocklist in mind when hitting such rather random issues.
@nebulon I’m wondering… since Cloudron depends entirely on Docker networking to function… is there maybe room to improve the IP blocklist checking so that it ignores any entries of the current Docker networking ranges such as 172.18.xxx.xxx addresses? It feels to me like there would never be a use-case to block those, and while we certainly need to use reliable IP lists (lesson learned, haha), I also wonder if this feature should be improved in the future to ignore any private IPs or at least any Docker IPs.
--
Dustin Dauncey
www.d19.ca -
@nebulon I’m wondering… since Cloudron depends entirely on Docker networking to function… is there maybe room to improve the IP blocklist checking so that it ignores any entries of the current Docker networking ranges such as 172.18.xxx.xxx addresses? It feels to me like there would never be a use-case to block those, and while we certainly need to use reliable IP lists (lesson learned, haha), I also wonder if this feature should be improved in the future to ignore any private IPs or at least any Docker IPs.
@d19dotca said in Shouldn't we get an alert when a service container fails / is unhealthy?:
checking so that it ignores any entries of the current Docker networking ranges such as 172.18.xxx.xxx addresses
For the moment, I have added validation to not accept such addresses . Ignoring this properly is more complicated (since we have to filter it at apply time) but atleast it won't let you save the blocklist easily .
-
 N nebulon forked this topic on