CPU usage breakdown?
-
One way is to determine the busy container right now first by using
systemd-cgtop. It would would display the docker containers like/docker/003d4ff9290ce4b92223b3bb57195a73fe8a4f5b8e473e74f6e54575e4bdadcbwhere the uuid then can be grepped for to find the container withdocker ps --no-trunc | grep 003d4ff9290ce4b92223b3bb57195a73fe8a4f5b8e473e74f6e54575e4bdadcb -
One way is to determine the busy container right now first by using
systemd-cgtop. It would would display the docker containers like/docker/003d4ff9290ce4b92223b3bb57195a73fe8a4f5b8e473e74f6e54575e4bdadcbwhere the uuid then can be grepped for to find the container withdocker ps --no-trunc | grep 003d4ff9290ce4b92223b3bb57195a73fe8a4f5b8e473e74f6e54575e4bdadcb@nebulon Thanks, I'll do that.
Is there a way to keep track of that in time or it only works in real time?
Would it be possible to have it in the same way as we can keep track of ram in each app and in the system page per app, somewhere in the future? I have no idea if that's possible to implement or not.

-
Problem is the parts that are using the most CPU are :
/ is using 793-796 % CPU 14.3 Gb MEMORY
cron.service 300+ % CPU 13 GB MEMORY
system.slice
docker.service
box.service
user.slice
containerd.serviceAnother problem or discrepancies I'm seeing if I dive into containers themselves is that it seems the containers that are using more CPU, the ones that often comes on top, are not tied to any domain/app in particular.
if I docker ps a specific container i see on the systemd-cgtop no matter what I try to match them I cannot associate these containers ID to my list of ID-Domains when I type cloudron list
it's like our box is running more containers than the number of app we have ?
can a container be on the loose and still running and using resources ?It does not make sense I know

-
-
The output is similar to top or htop, but that tool is aware of cgroups in linux, so it is easier to determine the app based on the container id.
-
Ok this is interesting, according to https://linux-mm.org/Drop_Caches this means the system tries to free up memory pages. And this essentially from time to time.
From Cloudron side we do not actively do this at all, so this is likely Ubuntu behavior. If this takes up a lot of cpu and for longer time periods, this may be related to the system I/O performance as such.I have to read up further though, for example is this is swap related and then it will indeed be painful if the swap is on some slow disk.
-
After last reboot,the process is now gone and CPU is more stable, quite crazy how this process completely freeze the cloudron box, Swap is being used at 338M over 4GB available and seem to increase very slowly, CPU is now around 50% more or less, still with Highs of 89%
i guess it will be better when on Ubuntu 20.x ? and moving to a new VPS or VDS soon probably
")
-
Not sure if Ubuntu 20.04 will change anything here, this seems to be a pretty normal thing since a long time for linux distros.
Also this may not indicate that you need more main memory or so, it might simply mean that the process of discarding and finding those resources takes long on your system. Thus my concern about system I/O speeds.
Which VPS provider are you currently using and is this an SSD system?
-
This looks ok and good enough to me. I am always a bit unsure about disk I/O measurements and also if this is the root cause here at all, but anyways maybe you can do some sanity check with
hdparm -t /dev/vda1(replace /dev/vda1 with you main disk partition)It should be somewhere above 500MB/s at least on provider with SSD in my experience.
-
FYI, CPU usage is now stable and around 13%, more or less since Contabo did, and I quote their email, a "technical adjustement".
You can clearly see on that monthly CPU chart, how it evolved (granted it's early days, but still):
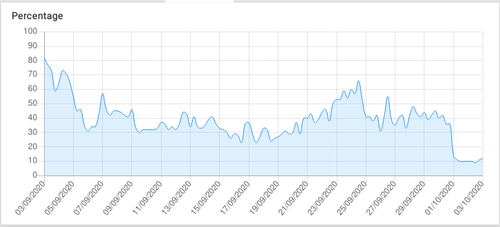
Not only this, but the dashboard now loads nearly instantly whereas beforehand, it could take up to 30 seconds.
Taking into account previous random issues with cheaper Contabo VPS in the past, I tend to think the issue was from Contabo from the start.
-
FYI, CPU usage is now stable and around 13%, more or less since Contabo did, and I quote their email, a "technical adjustement".
You can clearly see on that monthly CPU chart, how it evolved (granted it's early days, but still):
Not only this, but the dashboard now loads nearly instantly whereas beforehand, it could take up to 30 seconds.
Taking into account previous random issues with cheaper Contabo VPS in the past, I tend to think the issue was from Contabo from the start.
-
@ruihildt
nice to see it resolved outside of Cloudron.If you want a similarly sized and less expensive system, I can share an invite link for ssd nodes that's been working well for us.
-
Hello all, I've a similar problem and I want to ask you what can be the source causes coming from provider.
I'm running a Cloudron instance on a bare metal machine on Hetzner, and I get constantly CPU under 40-50%.
Let me know if I have to open a new post or keep continuing on this.
-
Hello all, I've a similar problem and I want to ask you what can be the source causes coming from provider.
I'm running a Cloudron instance on a bare metal machine on Hetzner, and I get constantly CPU under 40-50%.
Let me know if I have to open a new post or keep continuing on this.
-
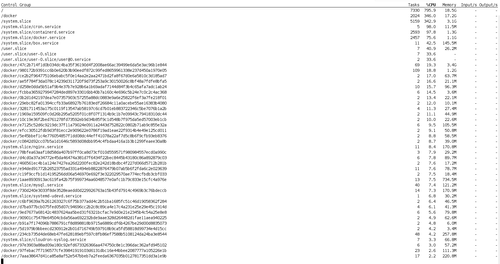
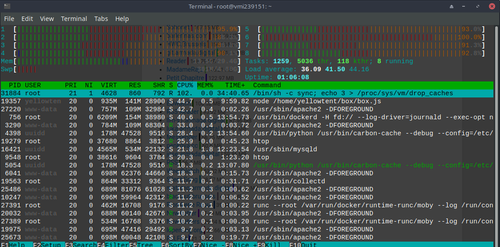
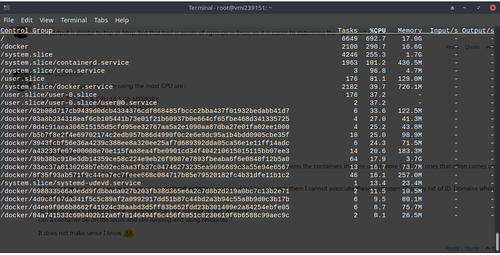
Hello @nebulon,
I did
systemd-cgtopand the result is this:
Then, from Cloudron control panel, the output is this:

Just few months ago, CPU it was stable to 1-2% in the not working hours time.
Now it seems to be little bit increased, so I was asking myself if this problem was related to Cloudron or to provider (Hetzner).
-
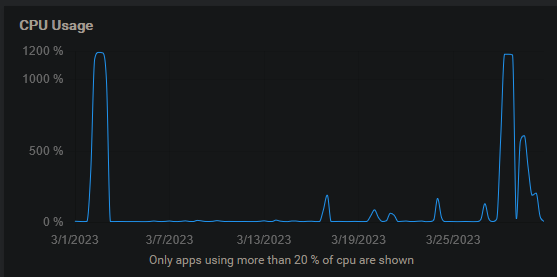
I seem to be having a similar issue. None of the apps in cloudron are using enough cpu to even show up here, but I am constantly needing to reboot the cloudron vm to get the cpu usage to drop back down to normal levels.
Not sure if you can tell from the graph, but I've needed to reboot it 3 times in the last month because apps become unresponsive whenever this happens.
htop won't help now because it was just rebooted yesterday and everything seems to be running smoothly.
Does anyone have any suggestions on how to find out why this is happening, or how to find out the cause?
Hello! It looks like you're interested in this conversation, but you don't have an account yet.
Getting fed up of having to scroll through the same posts each visit? When you register for an account, you'll always come back to exactly where you were before, and choose to be notified of new replies (either via email, or push notification). You'll also be able to save bookmarks and upvote posts to show your appreciation to other community members.
With your input, this post could be even better 💗
Register Login