Prometheus + Grafana actually working
-
Has anyone actually hooked up Grafana to Promtheus (both installed using cloudron)?
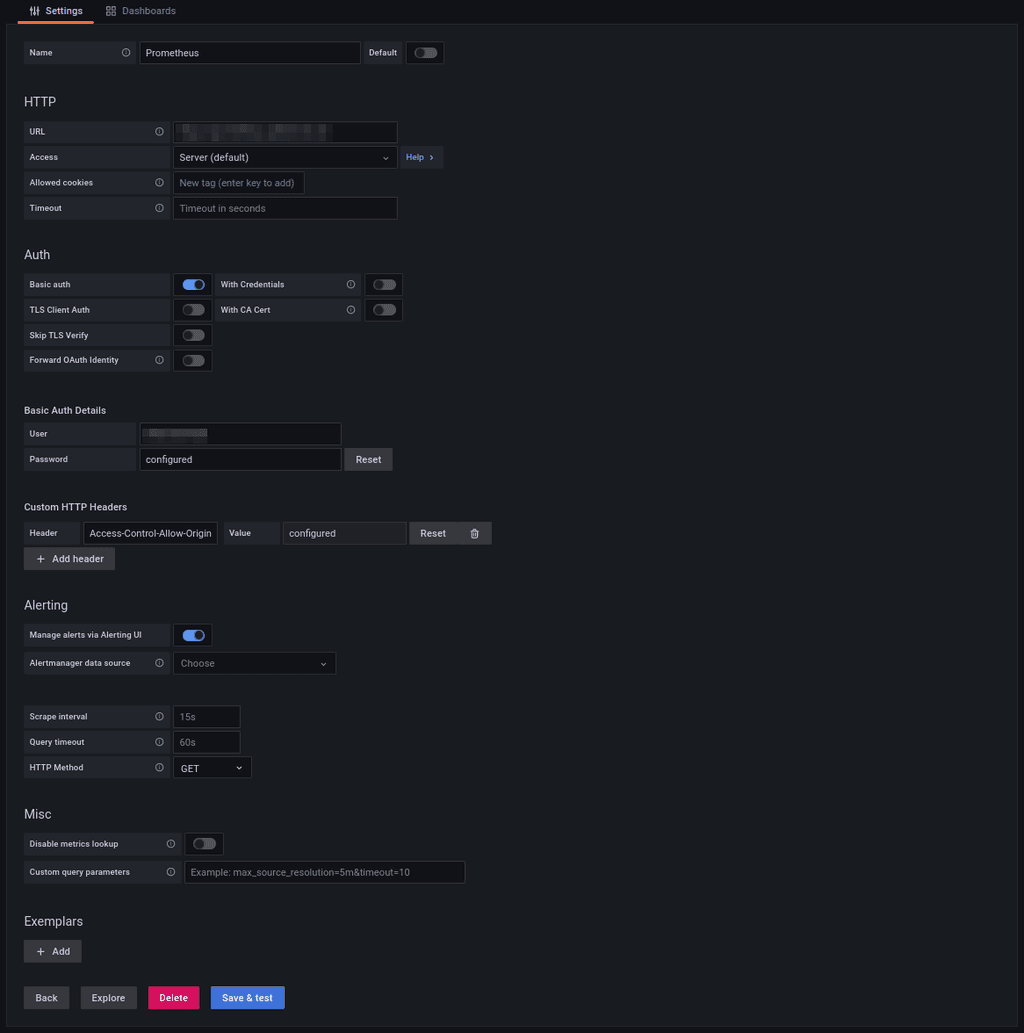
When I try and add the prometheus server I get CORS errors and it is preventing the page from redirecting (to authenticate I guess).
It says it needs a Access-Control-Allow-Origin header on the prometheus side to allow grafana hostname.
What is odd is that I have it set the access mode set to Server yet is it still trying to connect to it from the browser.
Any tips would be welcome. This would be great to get working.
-
Has anyone actually hooked up Grafana to Promtheus (both installed using cloudron)?
When I try and add the prometheus server I get CORS errors and it is preventing the page from redirecting (to authenticate I guess).
It says it needs a Access-Control-Allow-Origin header on the prometheus side to allow grafana hostname.
What is odd is that I have it set the access mode set to Server yet is it still trying to connect to it from the browser.
Any tips would be welcome. This would be great to get working.
-
@cadorn Yes I do.
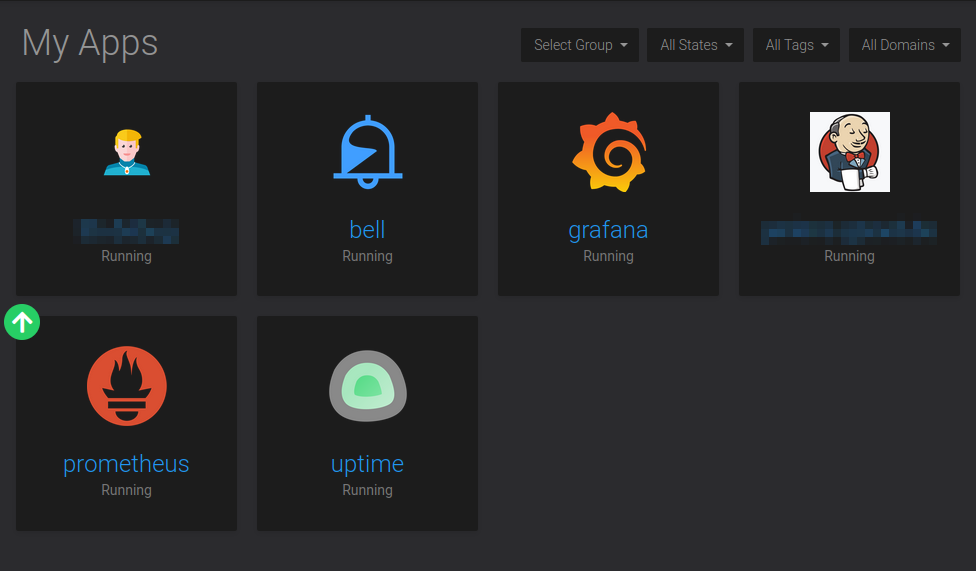
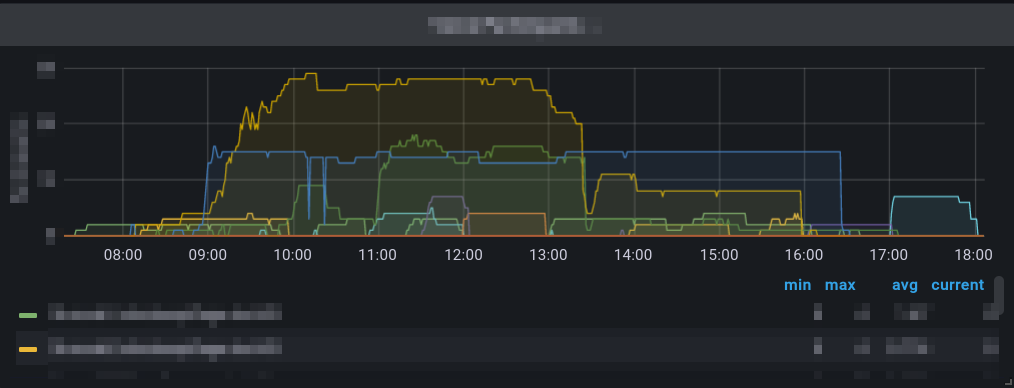

(alt: multiple screenshots showing grafana and prometheus hooked up in cloudron with data in a dashboard)
@BrutalBirdie Nice! Would you mind sharing setup instructions for absolute grafana noobs? I tried to set things up but failed completely with the documentation.
-
@BrutalBirdie Nice! Would you mind sharing setup instructions for absolute grafana noobs? I tried to set things up but failed completely with the documentation.
@andreasdueren well Grafana is only a view source, it does not provide any data it self.
I am collecting data from servers via prometheus and I am displaying this in grafana.ps: up the retention_time in your
/app/data/prometheus_variables.sh#!/bin/bash # https://prometheus.io/docs/prometheus/latest/storage/#operational-aspects export retention_time="180d"Default is 15 days which is... well useless for long term analytics.
https://prometheus.io/docs/prometheus/latest/storage/#operational-aspectsWhat exactly do you mean by
setup instructions?
Building a dashboard? Adding Datasources?Like my work? Consider donating a drink. Cheers!
-
@cadorn Yes I do.
(alt: multiple screenshots showing grafana and prometheus hooked up in cloudron with data in a dashboard)
@BrutalBirdie Ah thanks! Got it working now.
The browser trying to connect threw me off. Once I supplied Basic Auth credentials it works!
-
@andreasdueren well Grafana is only a view source, it does not provide any data it self.
I am collecting data from servers via prometheus and I am displaying this in grafana.ps: up the retention_time in your
/app/data/prometheus_variables.sh#!/bin/bash # https://prometheus.io/docs/prometheus/latest/storage/#operational-aspects export retention_time="180d"Default is 15 days which is... well useless for long term analytics.
https://prometheus.io/docs/prometheus/latest/storage/#operational-aspectsWhat exactly do you mean by
setup instructions?
Building a dashboard? Adding Datasources?@BrutalBirdie Yes, adding data sources. I wasn't able to get prometheus integrated

-
 N nebulon marked this topic as a question on
-
N nebulon has marked this topic as solved on
-
just had the same issue and wanted to add something here as a documentation:
If both Grafana and Prometheus are running as a cloudron-app, you can add Prometheus as a data-source in Grafana by inputting
http://<PROMETHEUS-SERVICE-UUID>:9090in the URL-field where PROMETHEUS-SERVICE-UUID can be found form the prometheus container either by looking up its installation location in the Storage-Tab or by connecting via terminal and copying the hostname.Cheers,
Jan -
just had the same issue and wanted to add something here as a documentation:
If both Grafana and Prometheus are running as a cloudron-app, you can add Prometheus as a data-source in Grafana by inputting
http://<PROMETHEUS-SERVICE-UUID>:9090in the URL-field where PROMETHEUS-SERVICE-UUID can be found form the prometheus container either by looking up its installation location in the Storage-Tab or by connecting via terminal and copying the hostname.Cheers,
Jan@Jan-Macenka said in Prometheus + Grafana actually working:
just had the same issue and wanted to add something here as a documentation:
If both Grafana and Prometheus are running as a cloudron-app, you can add Prometheus as a data-source in Grafana by inputting
http://<PROMETHEUS-SERVICE-UUID>:9090in the URL-field where PROMETHEUS-SERVICE-UUID can be found form the prometheus container either by looking up its installation location in the Storage-Tab or by connecting via terminal and copying the hostname.Cheers,
Jan@staff sounds like something that belongs in the docs
")
-
@andreasdueren well Grafana is only a view source, it does not provide any data it self.
I am collecting data from servers via prometheus and I am displaying this in grafana.ps: up the retention_time in your
/app/data/prometheus_variables.sh#!/bin/bash # https://prometheus.io/docs/prometheus/latest/storage/#operational-aspects export retention_time="180d"Default is 15 days which is... well useless for long term analytics.
https://prometheus.io/docs/prometheus/latest/storage/#operational-aspectsWhat exactly do you mean by
setup instructions?
Building a dashboard? Adding Datasources?@BrutalBirdie said in Prometheus + Grafana actually working:
ps: up the retention_time in your
/app/data/prometheus_variables.sh#!/bin/bash # https://prometheus.io/docs/prometheus/latest/storage/#operational-aspects export retention_time="180d"Default is 15 days which is... well useless for long term analytics.
https://prometheus.io/docs/prometheus/latest/storage/#operational-aspectsJust FYI, I noticed that /app/data/prometheus_variables.sh did not exist anymore - and in fact the app at startup will actually take prometheus_variables.sh if it DOES exist, and mv (replace) over /app/data/env.sh, which isn't good...
You can edit /app/data/env.sh itself though, and update the storage.tsdb.retention.time CLI option. Here is my env.sh for reference:
#!/bin/bash

# https://prometheus.io/docs/prometheus/latest/storage/#operational-aspects
# edit this variable to change startup options
export cli_options="--storage.tsdb.retention.time=180d --storage.tsdb.path=/app/data/storage"
Thanks
-
@BrutalBirdie said in Prometheus + Grafana actually working:
ps: up the retention_time in your
/app/data/prometheus_variables.sh#!/bin/bash # https://prometheus.io/docs/prometheus/latest/storage/#operational-aspects export retention_time="180d"Default is 15 days which is... well useless for long term analytics.
https://prometheus.io/docs/prometheus/latest/storage/#operational-aspectsJust FYI, I noticed that /app/data/prometheus_variables.sh did not exist anymore - and in fact the app at startup will actually take prometheus_variables.sh if it DOES exist, and mv (replace) over /app/data/env.sh, which isn't good...
You can edit /app/data/env.sh itself though, and update the storage.tsdb.retention.time CLI option. Here is my env.sh for reference:
#!/bin/bash

# https://prometheus.io/docs/prometheus/latest/storage/#operational-aspects
# edit this variable to change startup options
export cli_options="--storage.tsdb.retention.time=180d --storage.tsdb.path=/app/data/storage"
Thanks
Hello! It looks like you're interested in this conversation, but you don't have an account yet.
Getting fed up of having to scroll through the same posts each visit? When you register for an account, you'll always come back to exactly where you were before, and choose to be notified of new replies (either via email, or push notification). You'll also be able to save bookmarks and upvote posts to show your appreciation to other community members.
With your input, this post could be even better 💗
Register Login