-
 G girish moved this topic from Support on
-
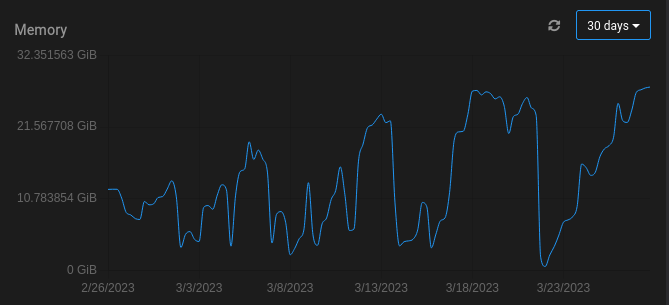
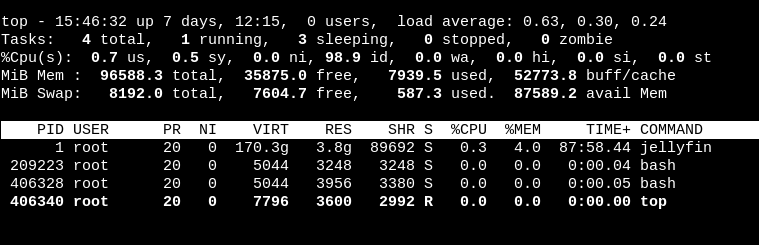
That seems like an extraordinarily large amount of RAM for a single app! If you open a web terminal to jellyfin , you can use tools like top/ps to see which process is using so much memory.
@girish I know very little about Jellyfin other than it's a powerful media app. Perhaps it's downloads and then processing large amounts of video?

-
That seems like an extraordinarily large amount of RAM for a single app! If you open a web terminal to jellyfin , you can use tools like top/ps to see which process is using so much memory.
-
@girish I know very little about Jellyfin other than it's a powerful media app. Perhaps it's downloads and then processing large amounts of video?
@jdaviescoates Jellyfin has cron jobs to remove transcoded cache or recently activity that is no longer used. I don't believe it has to do with the media, but I feel it will be hard to locate the problem.
-
That seems like an extraordinarily large amount of RAM for a single app! If you open a web terminal to jellyfin , you can use tools like top/ps to see which process is using so much memory.
@girish It looks like there might be a miss representation on the graphs?
My performance appears to be ok for moment on it. so my correlation might be off in terms of my issue, but I think here it might be not picking up the correct ram usages. What do you think? -
@girish It looks like there might be a miss representation on the graphs?
My performance appears to be ok for moment on it. so my correlation might be off in terms of my issue, but I think here it might be not picking up the correct ram usages. What do you think? -
@natzilla Can you post the output of
docker statson the server ? Just the jellyfin container output should be enough. Maybe something going wrong with the parsing. -
 N nebulon referenced this topic on
-
@girish Here you are
CONTAINER ID NAME CPU % MEM USAGE / LIMIT MEM % NET I/O BLOCK I/O PIDS
2058a37598b0 7d771f27-4c9e-48ff-b0ff-3c742305adb3 2.28% 27.12GiB / 29.12GiB 93.14% 1.01GB / 263GB 132GB / 65.5GB 56 -
@natzilla Was trying to check if we hit some parsing error in the code. Can you give me the output of
docker stats --format "{{ json . }}" --no-stream --no-trunc | grep 2058a37598b0?@girish as requested
{"BlockIO":"171GB / 83.4GB","CPUPerc":"0.14%","Container":"2058a37598b0","ID":"2058a37598b013a36a5a3d05a362e96dc4ad212dec1d5db162e372979bc47c38","MemPerc":"84.77%","MemUsage":"24.68GiB / 29.12GiB","Name":"7d771f27-4c9e-48ff-b0ff-3c742305adb3","NetIO":"1.27GB / 410GB","PIDs":"57"}
-
@girish as requested
{"BlockIO":"171GB / 83.4GB","CPUPerc":"0.14%","Container":"2058a37598b0","ID":"2058a37598b013a36a5a3d05a362e96dc4ad212dec1d5db162e372979bc47c38","MemPerc":"84.77%","MemUsage":"24.68GiB / 29.12GiB","Name":"7d771f27-4c9e-48ff-b0ff-3c742305adb3","NetIO":"1.27GB / 410GB","PIDs":"57"}
-
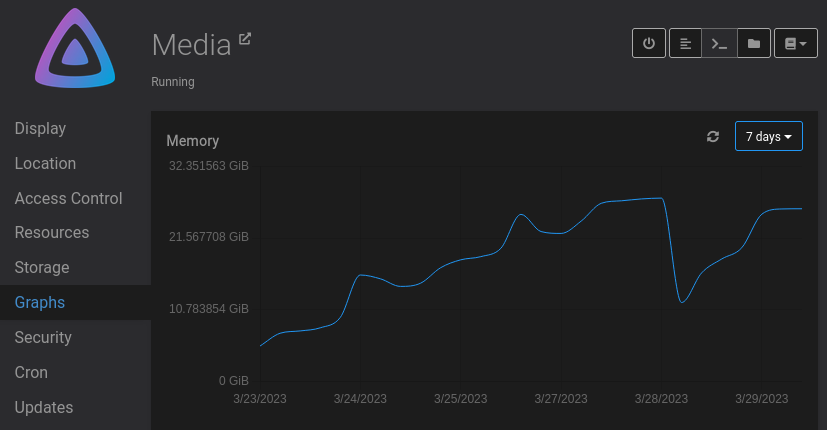
@natzilla So, the values in the graph come from the json you posted. Specifically
"MemUsage":"24.68GiB / 29.12GiB". (memory used / memory max) . This sort of matches what's displayed in the graph. -
@natzilla I was asking who the provider was, as sometimes they have a virtualization platform that can cause this as a way to reclaim memory for the underlying host from hungry VMs, etc.
Hello! It looks like you're interested in this conversation, but you don't have an account yet.
Getting fed up of having to scroll through the same posts each visit? When you register for an account, you'll always come back to exactly where you were before, and choose to be notified of new replies (either via email, or push notification). You'll also be able to save bookmarks and upvote posts to show your appreciation to other community members.
With your input, this post could be even better 💗
Register Login