-
 G girish moved this topic from Support on
-
That seems like an extraordinarily large amount of RAM for a single app! If you open a web terminal to jellyfin , you can use tools like top/ps to see which process is using so much memory.
@girish I know very little about Jellyfin other than it's a powerful media app. Perhaps it's downloads and then processing large amounts of video?

-
That seems like an extraordinarily large amount of RAM for a single app! If you open a web terminal to jellyfin , you can use tools like top/ps to see which process is using so much memory.
-
@girish I know very little about Jellyfin other than it's a powerful media app. Perhaps it's downloads and then processing large amounts of video?

@jdaviescoates Jellyfin has cron jobs to remove transcoded cache or recently activity that is no longer used. I don't believe it has to do with the media, but I feel it will be hard to locate the problem.
-
That seems like an extraordinarily large amount of RAM for a single app! If you open a web terminal to jellyfin , you can use tools like top/ps to see which process is using so much memory.
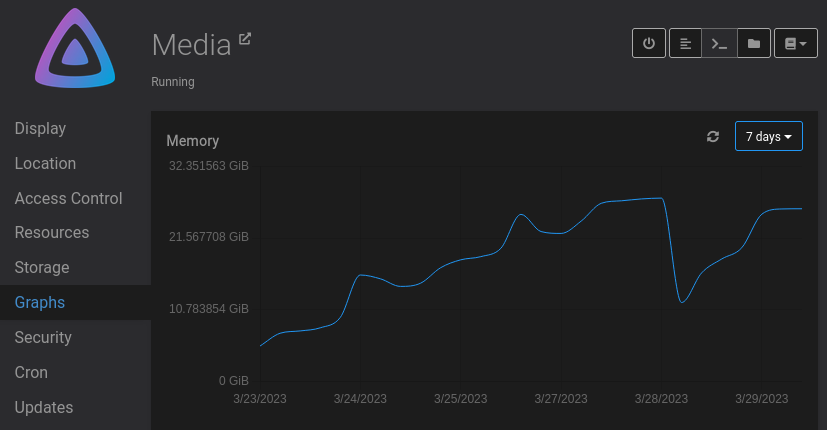
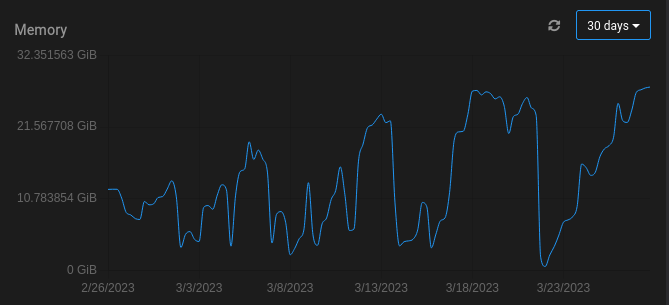
@girish It looks like there might be a miss representation on the graphs?


My performance appears to be ok for moment on it. so my correlation might be off in terms of my issue, but I think here it might be not picking up the correct ram usages. What do you think? -
@girish It looks like there might be a miss representation on the graphs?


My performance appears to be ok for moment on it. so my correlation might be off in terms of my issue, but I think here it might be not picking up the correct ram usages. What do you think? -
@natzilla Can you post the output of
docker statson the server ? Just the jellyfin container output should be enough. Maybe something going wrong with the parsing. -
 N nebulon referenced this topic on
-
@girish Here you are
CONTAINER ID NAME CPU % MEM USAGE / LIMIT MEM % NET I/O BLOCK I/O PIDS
2058a37598b0 7d771f27-4c9e-48ff-b0ff-3c742305adb3 2.28% 27.12GiB / 29.12GiB 93.14% 1.01GB / 263GB 132GB / 65.5GB 56 -
@natzilla Was trying to check if we hit some parsing error in the code. Can you give me the output of
docker stats --format "{{ json . }}" --no-stream --no-trunc | grep 2058a37598b0?@girish as requested
{"BlockIO":"171GB / 83.4GB","CPUPerc":"0.14%","Container":"2058a37598b0","ID":"2058a37598b013a36a5a3d05a362e96dc4ad212dec1d5db162e372979bc47c38","MemPerc":"84.77%","MemUsage":"24.68GiB / 29.12GiB","Name":"7d771f27-4c9e-48ff-b0ff-3c742305adb3","NetIO":"1.27GB / 410GB","PIDs":"57"}
-
@girish as requested
{"BlockIO":"171GB / 83.4GB","CPUPerc":"0.14%","Container":"2058a37598b0","ID":"2058a37598b013a36a5a3d05a362e96dc4ad212dec1d5db162e372979bc47c38","MemPerc":"84.77%","MemUsage":"24.68GiB / 29.12GiB","Name":"7d771f27-4c9e-48ff-b0ff-3c742305adb3","NetIO":"1.27GB / 410GB","PIDs":"57"}
-
@natzilla So, the values in the graph come from the json you posted. Specifically
"MemUsage":"24.68GiB / 29.12GiB". (memory used / memory max) . This sort of matches what's displayed in the graph. -
@natzilla I was asking who the provider was, as sometimes they have a virtualization platform that can cause this as a way to reclaim memory for the underlying host from hungry VMs, etc.

