Identify whats causing lags
-
Hi all
Running Cloudron on a Netcup VPS which in general is more than sufficient enough for what I am doing. Nextcloud, Mails, FreshRSS. Just a single user Cloudron instance for personal usage. According to monitor, RAM and CPU are always very low on usage. Within the last 6 hours there was one "spike" where CPU usage went up to 28%. Also RAM usage is below 4-5 GB (out of a total of 16GB) and overall I cannot see any problems. But from time to time the system is not responsive at all. I click on something and I have to wait. I checked logs after it happened again, but all I could see was the following:
GET /api/v1/apps 500 Internal Server Error Response timeout 20003.650 ms - 72
GET /api/v1/cloudron/memory 500 Internal Server Error Response timeout 20001.129 ms - 72
GET /api/v1/notifications?acknowledged=false&page=1&per_page=100 500 Internal Server Error Response timeout 20004.675 ms - 72
GET /api/v1/notifications?acknowledged=false&page=1&per_page=100 500 Internal Server Error Response timeout 20006.416 ms - 72
GET /api/v1/volumes 500 Internal Server Error Response timeout 20001.823 ms - 72
So I guess it does at least confirm my feeling of being unresponsive or laggy. Any chance to identify whats really causing these lags? Its not that the system is laggy in general. Most of the time its working like charm, everything is super fast and fluent. But it happens several times per day, even if just for a few seconds.
Any ideas? Bad I/O on VPS?
Thanks a lot
-
-
I would check if
dmesghas any interesting messages around the time the server is unresponsive. Does netcup have a server resource monitoring panel to help us debug ? We need something from the outside to determine the source of lagginess.@girish said in Identify whats causing lags:
I would check if
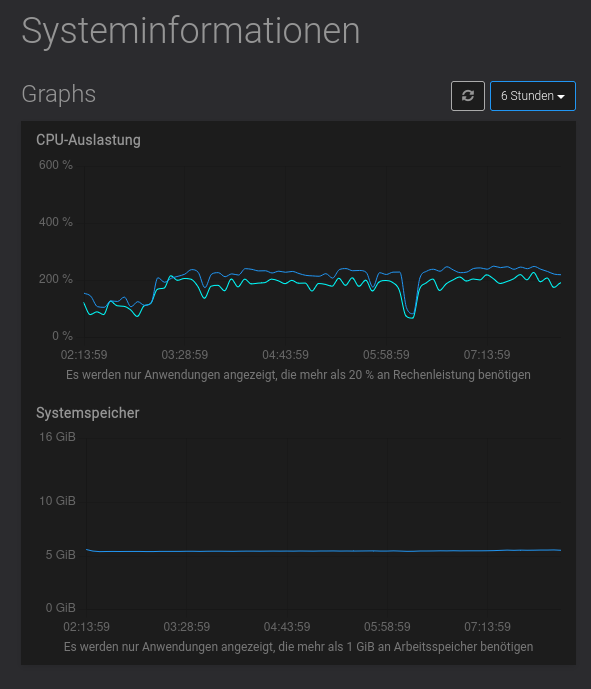
dmesghas any interesting messages around the time the server is unresponsive. Does netcup have a server resource monitoring panel to help us debug ? We need something from the outside to determine the source of lagginess.I will check it. Netcup shows some graphs:
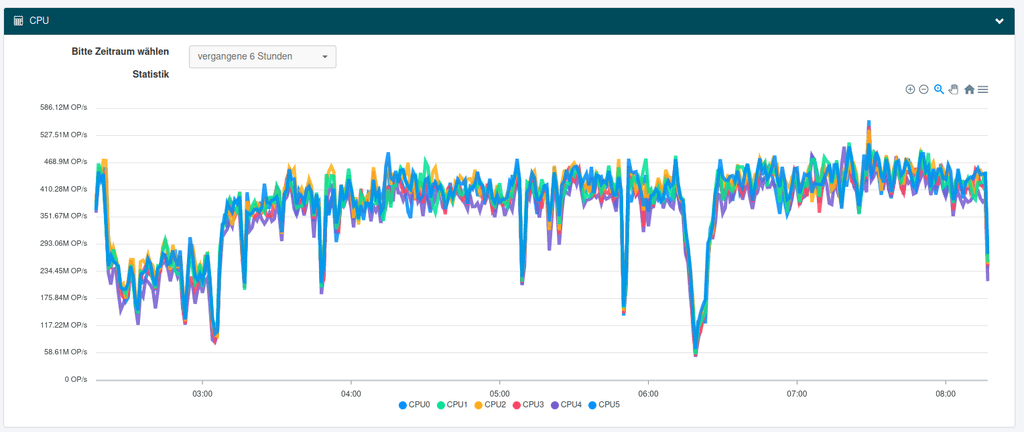

One question regarding Cloudron CPU usage graph. How is it possible to use a CPU for more than 100%? Or is it in relation to the last CPU utilization?
-
I also run Cloudron on Netcup but I always use their Root-Servers with more "dedicated" resources. I didn't notice any lag so far, I used digitalocean before.
@simong said in Identify whats causing lags:
I also run Cloudron on Netcup but I always use their Root-Servers with more "dedicated" resources. I didn't notice any lag so far, I used digitalocean before.
It is. Its the RS 2000 G9.5. 6 Cores and 16GB of RAM.
-
@girish said in Identify whats causing lags:
I would check if
dmesghas any interesting messages around the time the server is unresponsive. Does netcup have a server resource monitoring panel to help us debug ? We need something from the outside to determine the source of lagginess.I will check it. Netcup shows some graphs:
One question regarding Cloudron CPU usage graph. How is it possible to use a CPU for more than 100%? Or is it in relation to the last CPU utilization?
@Stardenver said in Identify whats causing lags:
One question regarding Cloudron CPU usage graph. How is it possible to use a CPU for more than 100%? Or is it in relation to the last CPU utilization?
You have 6 cores, so max. CPU usage is 6x 100%.
Having been a windows admin for a long time, I found this quite confusing as well in the beginning.Matrix: @nichu42:beeper.com
-
@Stardenver said in Identify whats causing lags:
One question regarding Cloudron CPU usage graph. How is it possible to use a CPU for more than 100%? Or is it in relation to the last CPU utilization?
You have 6 cores, so max. CPU usage is 6x 100%.
Having been a windows admin for a long time, I found this quite confusing as well in the beginning.@nichu42 said in Identify whats causing lags:
@Stardenver said in Identify whats causing lags:
One question regarding Cloudron CPU usage graph. How is it possible to use a CPU for more than 100%? Or is it in relation to the last CPU utilization?
You have 6 cores, so max. CPU usage is 6x 100%.
Having been a windows admin for a long time, I found this quite confusing as well in the beginning.So the graph showing 200% is 2 cores on 100% each (or something equal like 4 cores on 50% each)?
-
@Stardenver I have exactly the same issue on a NetCup RS 4000 G9 (6 cores, 32GB, 800GB SSD) for months. Randomly once a day the complete RS is "freezed" for about 30 seconds (I get Zabbix notices). I can't discover any specific changes in graphs around the time of freeze. Once I created a helpdesk ticket at NetCup but they responded with something like "what's in your RS is yours we don't know what's happening there".
@girish when I do
dmesgI do get result but the timestamps are like [1448020.553213]. The only kind of errors are like:Packet dropped: IN=eth0 OUT= MAC=***** SRC=***** DST=***** LEN=44 TOS=0x00 PREC=0x00 TTL=58 ID=48290 PROTO=TCP SPT=54306 DPT=15916 WINDOW=1024 RES=0x00 SYN URGP=0In the box.log there is also nothing around the time of freeze. Where to look now?
@imc67 said in Identify whats causing lags:
@Stardenver I have exactly the same issue on a NetCup RS 4000 G9 (6 cores, 32GB, 800GB SSD) for months. Randomly once a day the complete RS is "freezed" for about 30 seconds (I get Zabbix notices). I can't discover any specific changes in graphs around the time of freeze. Once I created a helpdesk ticket at NetCup but they responded with something like "what's in your RS is yours we don't know what's happening there".
@girish when I do
dmesgI do get result but the timestamps are like [1448020.553213]. The only kind of errors are like:Packet dropped: IN=eth0 OUT= MAC=***** SRC=***** DST=***** LEN=44 TOS=0x00 PREC=0x00 TTL=58 ID=48290 PROTO=TCP SPT=54306 DPT=15916 WINDOW=1024 RES=0x00 SYN URGP=0In the box.log there is also nothing around the time of freeze. Where to look now?
Weird thing is, that it doesn't seem to be related to whats going on on my VPS. I started to move 100GB of data onto it, using another VPS from Hetzner (rclone). No problems. I then activated server-side encryption and transferred even more data. I'd set up a Hetzner storage box and mounted it to my Cloudron instance and right now the Hetzner VPS is transfering 120GB of data to my Nextcloud which is encrypting and pushing through to the storage box. I don't have any problems at all. But then, out of nowhere, when CPU is actually on idle and maybe receiving a mail or Thunderbird is syncing calendar on Nextcloud, everything stops for a few seconds. Complete freeze and Firefox can't load anything and so does Thunderbird. After like 20 to 30 seconds everything is back to normal and responsive again. So it doesn't really seem to be related to tasks or processes on the server and right now I suspect the VPS itself to cause this.
-
@nichu42 said in Identify whats causing lags:
@Stardenver said in Identify whats causing lags:
One question regarding Cloudron CPU usage graph. How is it possible to use a CPU for more than 100%? Or is it in relation to the last CPU utilization?
You have 6 cores, so max. CPU usage is 6x 100%.
Having been a windows admin for a long time, I found this quite confusing as well in the beginning.So the graph showing 200% is 2 cores on 100% each (or something equal like 4 cores on 50% each)?
@Stardenver said in Identify whats causing lags:
So the graph showing 200% is 2 cores on 100% each (or something equal like 4 cores on 50% each)?
The latter is more probable. If you really want to know, run 'htop' from the command line.
Hello! It looks like you're interested in this conversation, but you don't have an account yet.
Getting fed up of having to scroll through the same posts each visit? When you register for an account, you'll always come back to exactly where you were before, and choose to be notified of new replies (either via email, or push notification). You'll also be able to save bookmarks and upvote posts to show your appreciation to other community members.
With your input, this post could be even better 💗
Register Login