Uninstalled apps stuck in the System Info page
-
Hi, I have moved a bunch of apps to another cloudron recently, these apps were taking a lot of space
moving to another cloudron and uninstall went smoothly but, even after reboot I keep seeing this :
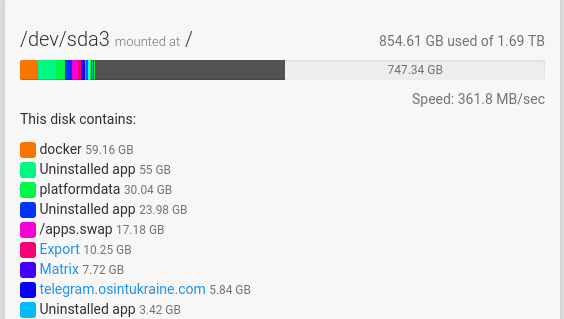
Is there anything I can do make sure the recovered space is claimed ?
BenB
-
Hi, I have moved a bunch of apps to another cloudron recently, these apps were taking a lot of space
moving to another cloudron and uninstall went smoothly but, even after reboot I keep seeing this :
Is there anything I can do make sure the recovered space is claimed ?
-
@benborges there's a refresh button on the top right. If you click it, those will go away. (du information is collected periodically and not instantly to reduce disk churn).
-
@girish Oh I already tried that, but it keeps spinning for like hours without even finishing
and if I restart and press it manually, it start spinning but then same issue. -
 G girish marked this topic as a question on
-
Oh I finally found something
Jun 30 10:41:51 box:apphealthmonitor app health: 43 running / 12 stopped / 0 unresponsive Jun 30 10:42:01 box:apphealthmonitor app health: 43 running / 12 stopped / 0 unresponsive Jun 30 10:42:07 box:cloudron Getting logs for box GET /well-known-handler/matrix/server 404 Not Found No custom well-known config 1.852 ms - 71 GET /well-known-handler/matrix/server 404 Not Found No custom well-known config 2.104 ms - 71 GET /well-known-handler/matrix/server 404 Not Found No custom well-known config 2.109 ms - 71 GET /well-known-handler/matrix/server 404 Not Found No custom well-known config 2.667 ms - 71 Jun 30 10:42:11 box:apphealthmonitor app health: 43 running / 12 stopped / 0 unresponsive Jun 30 10:42:21 box:apphealthmonitor app health: 43 running / 12 stopped / 0 unresponsive [ServiceUnavailableError]: Response timeout at IncomingMessage.<anonymous> (/home/yellowtent/box/node_modules/connect-timeout/index.js:84:8) at IncomingMessage.emit (node:events:513:28) at Timeout._onTimeout (/home/yellowtent/box/node_modules/connect-timeout/index.js:49:11) at listOnTimeout (node:internal/timers:559:17) at processTimers (node:internal/timers:502:7) { code: 'ETIMEDOUT', timeout: 20000 GET /api/v1/cloudron/graphs?fromMinutes=360 500 Internal Server Error Response timeout 20023.193 ms - 72 -
Appears to be running normally :
Jun 30 10:42:44 [pid: 22|app: 0|req: 1942/5433] 172.18.0.1 () {24 vars in 713 bytes} [Fri Jun 30 08:42:43 2023] GET /graphite-web/render?target=summarize%28collectd.localhost.docker-stats-redis%3Ae7f262fe-a367-4cba-9d82-a45b111f8cb7.counter-blockio-read%2C%20%225min%22%2C%20%22sum%22%29&format=json&from=-360min&until=now&noNullPoints=false => generated 2 bytes in 75 msecs (HTTP/1.1 200) 4 headers in 137 bytes (1 switches on core 0) Jun 30 10:42:44 [pid: 22|app: 0|req: 1943/5434] 172.18.0.1 () {24 vars in 715 bytes} [Fri Jun 30 08:42:44 2023] GET /graphite-web/render?target=summarize%28collectd.localhost.docker-stats-redis%3Ae7f262fe-a367-4cba-9d82-a45b111f8cb7.counter-blockio-write%2C%20%225min%22%2C%20%22sum%22%29&format=json&from=-360min&until=now&noNullPoints=false => generated 2 bytes in 12 msecs (HTTP/1.1 200) 4 headers in 137 bytes (1 switches on core 0) Jun 30 10:42:44 [pid: 22|app: 0|req: 1944/5435] 172.18.0.1 () {24 vars in 713 bytes} [Fri Jun 30 08:42:44 2023] GET /graphite-web/render?target=summarize%28collectd.localhost.docker-stats-redis%3Ae7f262fe-a367-4cba-9d82-a45b111f8cb7.counter-network-read%2C%20%225min%22%2C%20%22sum%22%29&format=json&from=-360min&until=now&noNullPoints=false => generated 2 bytes in 7 msecs (HTTP/1.1 200) 4 headers in 137 bytes (1 switches on core 0) Jun 30 10:42:44 [pid: 22|app: 0|req: 1945/5436] 172.18.0.1 () {24 vars in 715 bytes} [Fri Jun 30 08:42:44 2023] GET /graphite-web/render?target=summarize%28collectd.localhost.docker-stats-redis%3Ae7f262fe-a367-4cba-9d82-a45b111f8cb7.counter-network-write%2C%20%225min%22%2C%20%22sum%22%29&format=json&from=-360min&until=now&noNullPoints=false => generated 2 bytes in 6 msecs (HTTP/1.1 200) 4 headers in 137 bytes (1 switches on core 0) Jun 30 10:42:44 [pid: 22|app: 0|req: 1946/5437] 172.18.0.1 () {24 vars in 713 bytes} [Fri Jun 30 08:42:44 2023] GET /graphite-web/render?target=summarize%28collectd.localhost.docker-stats-redis%3Ae7f262fe-a367-4cba-9d82-a45b111f8cb7.gauge-blockio-read%2C%20%22360min%22%2C%20%22max%22%29&format=json&from=-360min&until=now&noNullPoints=false => generated 2 bytes in 84 msecs (HTTP/1.1 200) 4 headers in 137 bytes (1 switches on core 0) Jun 30 10:42:44 [pid: 22|app: 0|req: 1947/5439] 172.18.0.1 () {24 vars in 713 bytes} [Fri Jun 30 08:42:44 2023] GET /graphite-web/render?target=summarize%28collectd.localhost.docker-stats-redis%3Ae7f262fe-a367-4cba-9d82-a45b111f8cb7.gauge-network-read%2C%20%22360min%22%2C%20%22max%22%29&format=json&from=-360min&until=now&noNullPoints=false => generated 2 bytes in 12 msecs (HTTP/1.1 200) 4 headers in 137 bytes (1 switches on core 0) Jun 30 10:42:44 [pid: 23|app: 0|req: 3492/5438] 172.18.0.1 () {24 vars in 715 bytes} [Fri Jun 30 08:42:44 2023] GET /graphite-web/render?target=summarize%28collectd.localhost.docker-stats-redis%3Ae7f262fe-a367-4cba-9d82-a45b111f8cb7.gauge-blockio-write%2C%20%22360min%22%2C%20%22max%22%29&format=json&from=-360min&until=now&noNullPoints=false => generated 2 bytes in 79 msecs (HTTP/1.1 200) 4 headers in 137 bytes (1 switches on core 0) Jun 30 10:42:44 [pid: 23|app: 0|req: 3493/5440] 172.18.0.1 () {24 vars in 715 bytes} [Fri Jun 30 08:42:44 2023] GET /graphite-web/render?target=summarize%28collectd.localhost.docker-stats-redis%3Ae7f262fe-a367-4cba-9d82-a45b111f8cb7.gauge-network-write%2C%20%22360min%22%2C%20%22max%22%29&format=json&from=-360min&until=now&noNullPoints=false => generated 2 bytes in 7 msecs (HTTP/1.1 200) 4 headers in 137 bytes (1 switches on core 0) -
First time I see it, what can I try to reproduce it ?
VPS 10 vCPU Cores
RAM60 GB RAM
Storage
1.6 TB SSDIt's not using more than 20GB of memory at all time and CPU is around 30% with spikes when a bunch of python jobs run
it's doing a lot of disk operation though (downloading and moving video files) -
If you click the refresh button there, it spins off a task in the background collecting stats, this also happens via cron. So the issue then is that this task never succeeds.
Open up the server logs from the topright of the system info page, then click the refresh button, then in the logs you will see some info about that task with a path to its log file. Then check that log file to get more info.
-
I have SSHed into it and found the task that seem to be associated with this and found this :
➜  tasks grc tail -f 5728.log

2023-06-30T03:48:53.238Z box:tasks update 5728: {"percent":29.571428571428573,"message":"Checking contents of /dev/sda2"}
2023-06-30T03:48:53.239Z box:shell system spawn: /usr/bin/sudo -S /home/yellowtent/box/src/scripts/hdparm.sh //u283231.your-storagebox.de/backup
2023-06-30T03:48:53.258Z box:shell system (stderr): //u283231.your-storagebox.de/backup: No such file or directory

2023-06-30T03:48:53.259Z box:shell system code: 2, signal: null
2023-06-30T03:48:53.260Z box:tasks update 5728: {"message":"hdparm error: system exited with code 2 signal null"}
2023-06-30T03:48:53.261Z box:tasks update 5728: {"percent":43.85714285714286,"message":"Checking contents of //username.your-storagebox.de/backup"}
2023-06-30T03:48:53.262Z box:tasks update 5728: {"message":"Checking du of {\"type\":\"volume\",\"id\":\"8190a2686d454328b1ef83461c30de1a\",\"path\":\"/mnt/volumes/8190a2686d454328b1ef83461c30de1a\"}"}
2023-06-30T03:48:53.263Z box:shell system spawn: /usr/bin/sudo -S /home/yellowtent/box/src/scripts/du.sh /mnt/volumes/8190a2686d454328b1ef83461c30de1a
this is the storage box of my hetzner backup, and the backup folder does exist there, would that be the issue ?
BenB
-
I have SSHed into it and found the task that seem to be associated with this and found this :
➜  tasks grc tail -f 5728.log

2023-06-30T03:48:53.238Z box:tasks update 5728: {"percent":29.571428571428573,"message":"Checking contents of /dev/sda2"}
2023-06-30T03:48:53.239Z box:shell system spawn: /usr/bin/sudo -S /home/yellowtent/box/src/scripts/hdparm.sh //u283231.your-storagebox.de/backup
2023-06-30T03:48:53.258Z box:shell system (stderr): //u283231.your-storagebox.de/backup: No such file or directory

2023-06-30T03:48:53.259Z box:shell system code: 2, signal: null
2023-06-30T03:48:53.260Z box:tasks update 5728: {"message":"hdparm error: system exited with code 2 signal null"}
2023-06-30T03:48:53.261Z box:tasks update 5728: {"percent":43.85714285714286,"message":"Checking contents of //username.your-storagebox.de/backup"}
2023-06-30T03:48:53.262Z box:tasks update 5728: {"message":"Checking du of {\"type\":\"volume\",\"id\":\"8190a2686d454328b1ef83461c30de1a\",\"path\":\"/mnt/volumes/8190a2686d454328b1ef83461c30de1a\"}"}
2023-06-30T03:48:53.263Z box:shell system spawn: /usr/bin/sudo -S /home/yellowtent/box/src/scripts/du.sh /mnt/volumes/8190a2686d454328b1ef83461c30de1a
this is the storage box of my hetzner backup, and the backup folder does exist there, would that be the issue ?
-
@benborges in theory, the code should move on despite the failure to get the du of one app. Does that task complete? or are these the last lines you posted?
-
@girish those are the last lines, it never completes apparently
by the way, this is the du of one remote storage volume, not an app itself -
hangs also here, it has a few GB of backup and also some 40 or 50 GB of music files
1.3 TB of data for 5 TB availableDUF works fine, like instantly, but not DU
It's a CIFS mount, maybe I should unmount it, remount it as SSHFS and see if goes better, hmm
