Cloudron makes it easy to run web apps like WordPress, Nextcloud, GitLab on your server. Find out more or install now.


Skip to content
  • Categories
  • Recent
  • Tags
  • Popular
  • Bookmarks
  • Search
Skins
  • Light
  • Cerulean
  • Cosmo
  • Flatly
  • Journal
  • Litera
  • Lumen
  • Lux
  • Materia
  • Minty
  • Morph
  • Pulse
  • Sandstone
  • Simplex
  • Sketchy
  • Spacelab
  • United
  • Yeti
  • Zephyr
  • Dark
  • Cyborg
  • Darkly
  • Quartz
  • Slate
  • Solar
  • Superhero
  • Vapor

  • Default (No Skin)
  • No Skin
Collapse
Brand Logo

Cloudron Forum

Apps | Demo | Docs | Install
mmolivierM

mmolivier

@mmolivier
About
Posts
15
Topics
6
Shares
0
Groups
0
Followers
0
Following
0

Posts

Recent Best Controversial

  • System Info - CPU Usage chart
    mmolivierM mmolivier

    Hi @girish that's understandable, profiling is beyond what Cloudron is meant to do. However it would be useful if the charts would be more accurate.

    Imagine this usecase: You have an install with 10 apps. Suddenly there's a lot of incoming traffic on one of these apps, slowing the entire machine down. If this happens, at least you'd want to be able to quickly identify the app which should be stopped.

    Anyways, it's understandable that this doesn't get much priority given the amazing popularity on this thread 🤣

    Feature Requests graphs performance

  • System Info - CPU Usage chart
    mmolivierM mmolivier

    Hi, would it be possible to include the services/processes within the CPU Usage chart?

    Some context. My chart is looking like this at the moment:

    906b373e-4d5b-4026-8362-9f8ccb119894-image.png

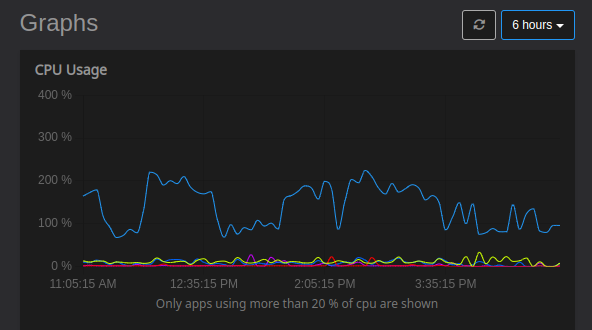
    The blue line is shown as "CPU" while the other lines are apps.

    If I open top from within the shell, I can see there are 3 processes which are utilizing a lot of CPU:

    1. mysqld: After enabling performance_schema through these instructions (thanks by the way!), I've found out that one of my apps has inefficient queries. It would be very very helpful to me if this CPU load would be included as part of this specific app within the chart.
    2. minio: Pretty much the same as what was happening with mysqld, I'd expect this CPU load to be included in my Minio app.
    3. php: Pretty much the same as what was happening with mysqld, I'd expect this CPU load to be included in the apps that are running heavy PHP scripts.

    What would be really cool, but I can imagine this to be too much work (maybe an idea for a separate app or something), would be the ability to enable some kind of debug mode to get more details on CPU usage, e.g. recent queries, recent file reads/writes, details on processes etc.

    I hope this request makes sense 😁 Thanks!

    Feature Requests graphs performance

  • Performance stats
    mmolivierM mmolivier

    Hi all,
    I'd like to have more insight in how every app and service is performing. For example:

    • Average response time for each app
    • Whether an app is doing too many I/O operations (and/or swapping)
    • Whether I should increase RAM on services such as MySQL
    • Some API for error logging and reporting of async tasks

    Some general dashboard with a notification system would be brilliant.

    Any idea how to approach this without having to build it from scratch or using some expensive and overly complex cloud service?

    Thanks!

    Feature Requests
  • Login

  • Don't have an account? Register

  • Login or register to search.
  • First post
    Last post
0
  • Categories
  • Recent
  • Tags
  • Popular
  • Bookmarks
  • Search