Cloudron v9: huge disk I/O is this normal/safe/needed?
-
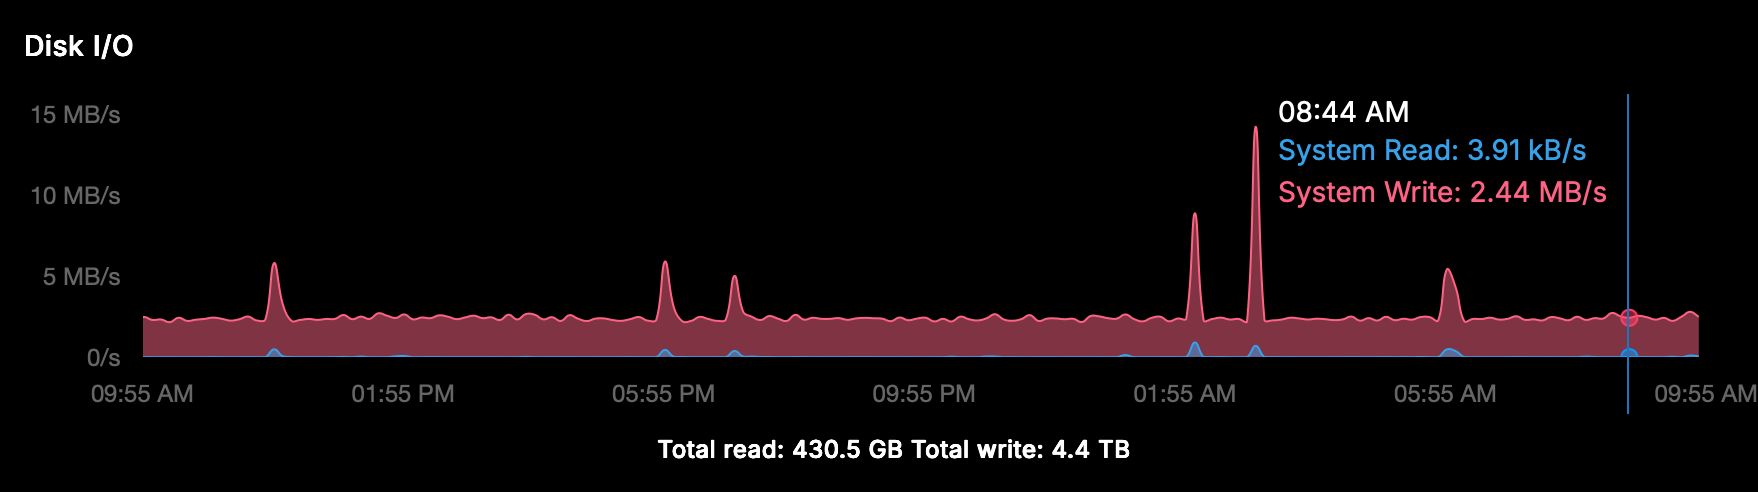
We have even more
 I doubt our server wrote or read so much. Must be something wrong with the reporting, investigating...
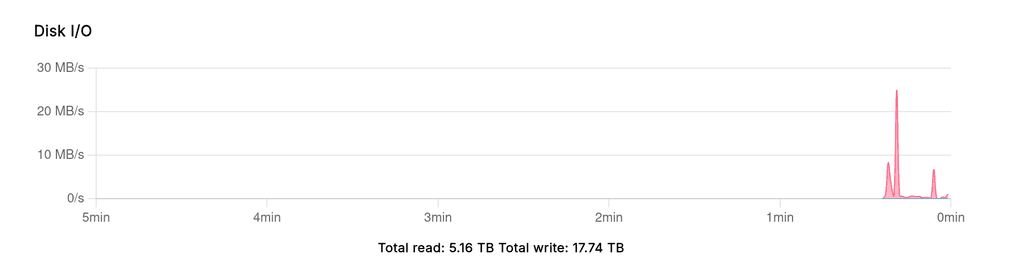
@girish said in Cloudron v9: huge disk I/O is this normal/safe/needed?:
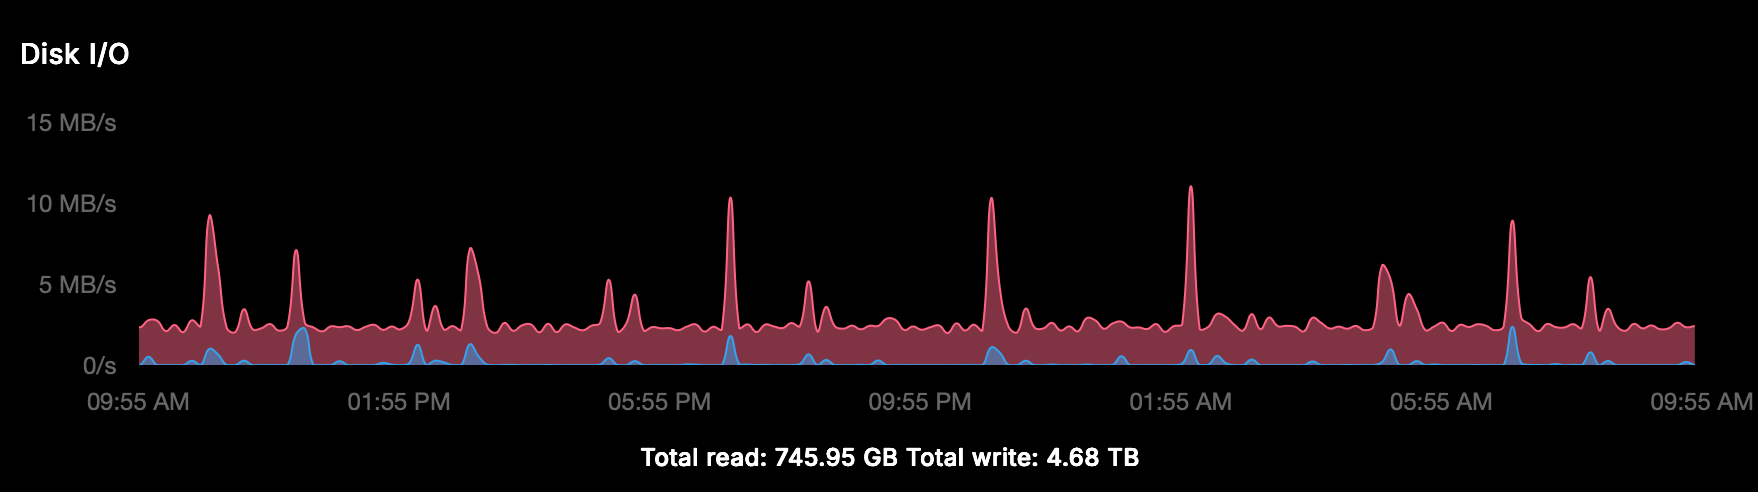
We have even more
I doubt our server wrote or read so much. Must be something wrong with the reporting, investigating...But at least your Writ I/O graph/speed is almost zero?!
-
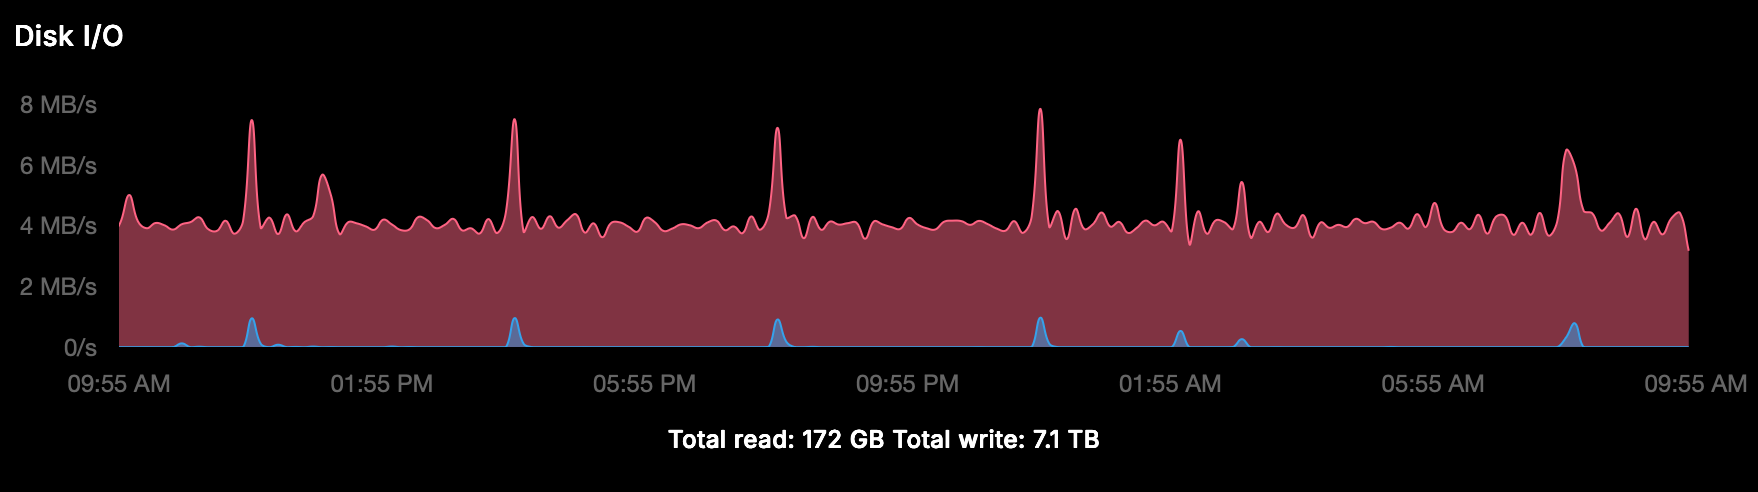
Also in the Netcup SCP it shows, so it seems there is seriously something wrong?
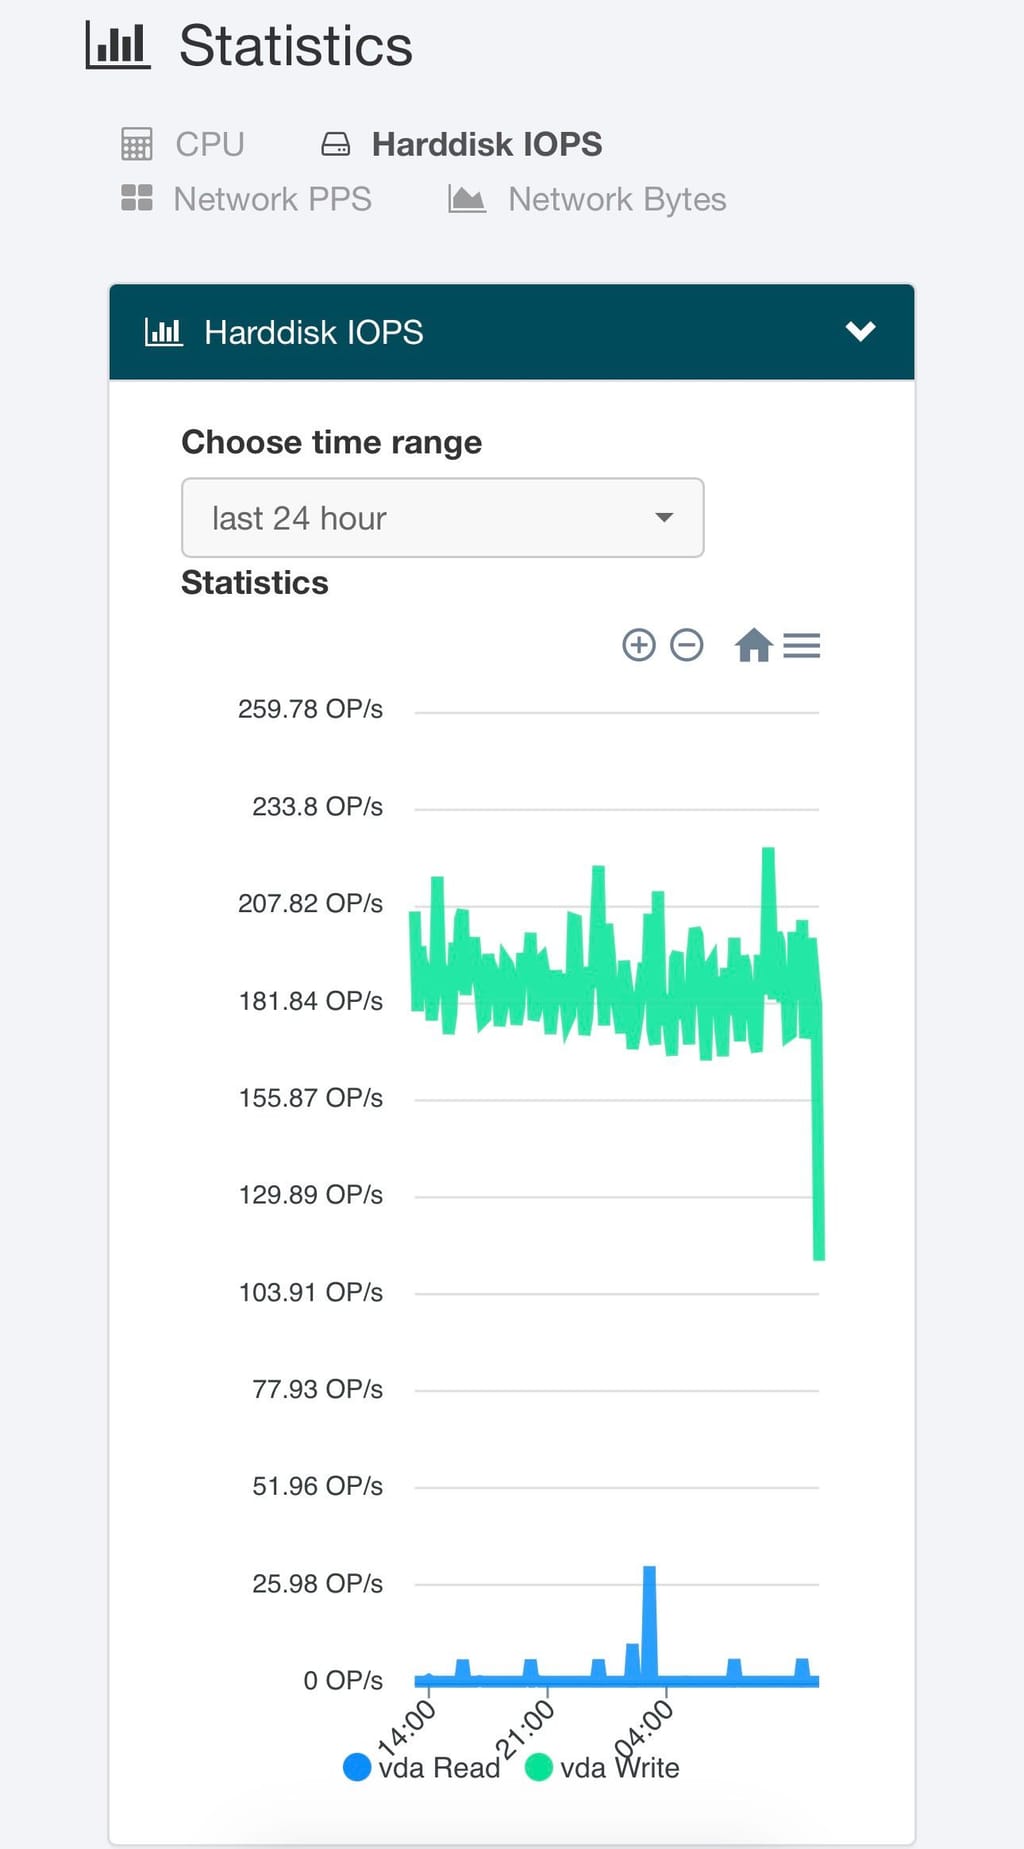
(The last part of the graph is not representative, zooming in to 6 hours is straight line) -
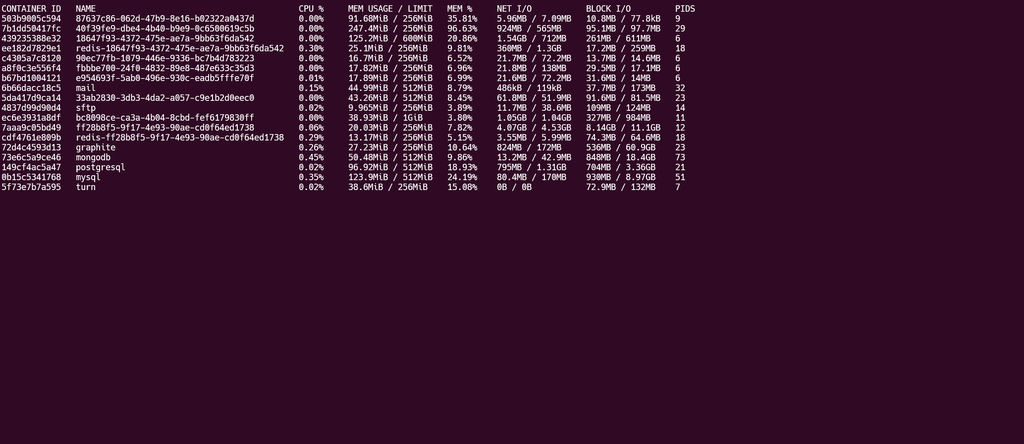
I checked many servers and it's mostly under 1MBps all the time . Does 'docker stats' show anything interesting (if it's a container that is hogging cpu)? Not sure what else you have installed on your server?
@girish said in Cloudron v9: huge disk I/O is this normal/safe/needed?:
'docker stats'
it's impossible to have a view with this, every second tens of docker containers are created (cron?) so it keeps listing and growing.
Is there a proper way to do some inspections with disk I/O in mind? Or shall I give you access to have a view?
-
its not default installed:
Command 'iotop' not found, but can be installed with: apt install iotop # version 0.6-24-g733f3f8-1.1ubuntu0.1, or apt install iotop-c # version 1.21-1 -
and now?
-
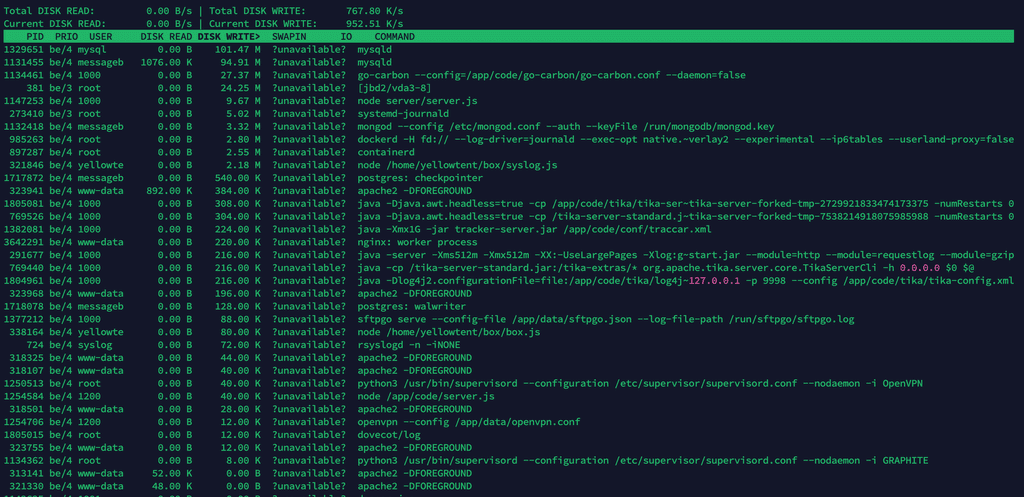
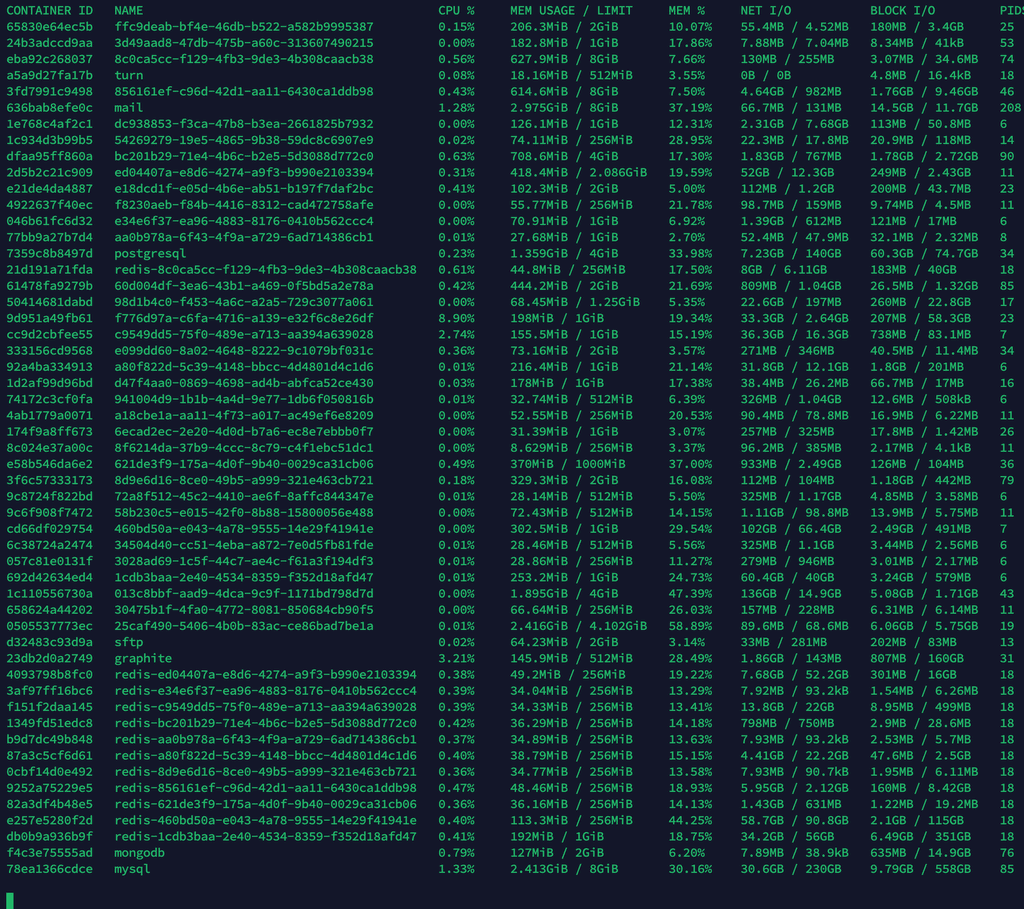
ok thanks, below the result after just a few minutes, I'm not a technician but as far as I can see it's mainly mysql which is writing (I sorted Write):
-
Since we debugged some other issue on that server, was also taking a look at the disk I/O. So basically the mysql service is doing a lot of disk I/O (also as see in the screenshot).
It does seem the mysql addon is just queried and written to a lot. So likely one of the many installed apps using it might commit a lot to the database. I didn't want to stop apps, but maybe you can try to stop individual apps which use mysql one-by-one to hopefully find the one which causes the constant writes.
-
Thanks @nebulon for your time, together with ChatGPT I did deeper analysis but I also read this: https://docs.cloudron.io/troubleshooting/#mysql
Two instances of MySQL
There are two instances of MySQL on Cloudron. One instance runs on the host and is used by the platform. Another instance is the MySQL addon which runs in a container named mysql and is shared by apps. This test is related to the host MySQL.
Doesn't this mean that the mysql service in iotop is the "host version" that has nothing to do with the apps?
For now "we" (I) have seen this:
Summary of Disk Write I/O Observation on Cloudron Host
- Using iotop, the host shows consistently high disk write I/O (4–5 MB/s).
- Analysis of MySQL processes (mysqld) indicates these are responsible for the majority of the write load.
- The high write I/O is primarily due to InnoDB internal activity: buffer pool flushes, redo log writes, and metadata updates, mostly from the box database (eventlog, tasks, backups).
In about 10 minutes this is the Disk Write I/O (so 1.5GB in 10 minutes)
Total DISK READ:         0.00 B/s | Total DISK WRITE:         2.73 M/s
Current DISK READ:       0.00 B/s | Current DISK WRITE:       4.25 M/s
    TID  PRIO  USER     DISK READ DISK WRITE>  SWAPIN      IO    COMMAND
  21250 be/4 messageb      0.00 B   1038.50 M  ?unavailable?  mysqld
    936 be/4 mysql         0.00 B    465.28 M  ?unavailable?  mysqld
I stopped about 25% of the apps at a certain moment with no significant result, this is the current situation (IMHO not really intensive application and they have low traffic):
App 	Status
Yourls	Running
WordPress (Developer)	Running
WordPress (Developer)	Running
WordPress (Developer)	Running
WordPress (Developer)	Running
WordPress (Developer)	Running
WordPress (Developer)	Stopped
WordPress (Developer)	Running
WordPress (Developer)	Stopped
WordPress (Developer)	Running
WordPress (Developer)	Running
WordPress (Developer)	Running
WordPress (Developer)	Running
WordPress (Developer)	Running
WordPress (Developer)	Running
WordPress (Developer)	Stopped
WordPress (Developer)	Running
Taiga	Stopped
Surfer	Running
Surfer	Stopped
Roundcube	Running
Roundcube	Running
Omeka S	Stopped
Moodle	Stopped
LAMP	Running
Roundcube	Running
Roundcube	Running
Roundcube	Running
Pretix	Stopped
MiroTalk SFU	Running
Matomo	Running
FreeScout	Running
FreeScout	Running
Espo CRM	Running
What to do next to find the root cause?
@imc67 said in Cloudron v9: huge disk I/O is this normal/safe/needed?:
I stopped about 25% of the apps at a certain moment with no significant result
I think @nebulon was suggesting to stop apps one by one to see if one particular app is causing the problem.
-
It’s a production server, isn’t it ridiculous to stop these apps to watch resource behavior? There must be tools or ways to find the root cause don’t you think?
Beside that it’s the host MySQL does it has anything to do with apps?
-
It’s a production server, isn’t it ridiculous to stop these apps to watch resource behavior? There must be tools or ways to find the root cause don’t you think?
Beside that it’s the host MySQL does it has anything to do with apps?
-
Hello @imc67
You can use the PID from the process to figure out what mysql service it is.e.g. your
iotopshows formysqldthe pid1994756.
You can runsystemctl status mysql.serviceand there is the pid displayed:● mysql.service - MySQL Community Server Loaded: loaded (/usr/lib/systemd/system/mysql.service; enabled; preset: enabled) Active: active (running) since Mon 2025-12-01 09:17:59 UTC; 1 week 5 days ago Main PID: 1994756 (mysqld) Status: "Server is operational" Tasks: 48 (limit: 4603) Memory: 178.7M (peak: 298.0M swap: 95.4M swap peak: 108.7M) CPU: 1h 41min 31.520s CGroup: /system.slice/mysql.service └─1994756 /usr/sbin/mysqld Notice: journal has been rotated since unit was started, output may be incomplete.So from
iotopI can confirm that the system mysqld service is pid1994756so I'd know to inspect the system mysqld service and not the docker mysql service.You can also get the pid from the
mysqldinside the docker container withdocker top mysql:docker top mysql UID PID PPID C STIME TTY TIME CMD root 1889 1512 0 Nov07 ? 00:06:17 /usr/bin/python3 /usr/bin/supervisord --configuration /etc/supervisor/supervisord.conf --nodaemon -i Mysql usbmux 3079 1889 0 Nov07 ? 03:49:38 /usr/sbin/mysqld usbmux 3099 1889 0 Nov07 ? 00:00:11 node /app/code/service.jsThen I know the
mysqldpid of the docker service is3079which I can check again with the system:ps uax | grep -i 3079 usbmux 3079 0.4 1.0 1587720 43692 ? Sl Nov07 229:38 /usr/sbin/mysqldNow we can differentiate between the two.
Okay.
Now that we can differentiate between the two, you can observeiotopand see which one has a high I/O.
After you narrow it down to either one, then we can do some analysis what database / table get accesses the most even further narrow it down.
Hello! It looks like you're interested in this conversation, but you don't have an account yet.
Getting fed up of having to scroll through the same posts each visit? When you register for an account, you'll always come back to exactly where you were before, and choose to be notified of new replies (either via email, or push notification). You'll also be able to save bookmarks and upvote posts to show your appreciation to other community members.
With your input, this post could be even better 💗
Register Login