Orange circles in Services
-
@subven I think the starting issue is something else. If you do
systemctl restart box, I think they will all become running again. Can you please try?@girish said in Orange circles in Services:
@subven I think the starting issue is something else. If you do
systemctl restart box, I think they will all become running again. Can you please try?Yes they are
") I was confused because even
I was confused because even box:apphealthmonitorsaid the apps are up. -
Kinda same for me. Freshly installed server + imported Cloudron 6.1.2 backup. The server the backup is from did not had the problem.
-
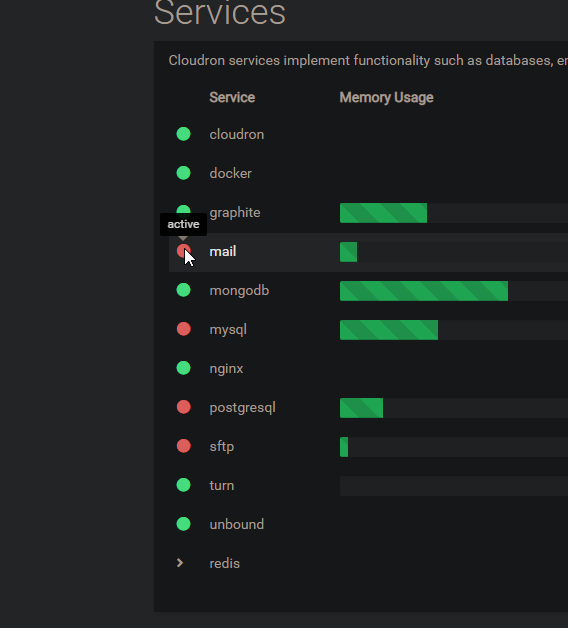
@subven interesting that it shows an "active" tooltip. Is this state consistent across page reloads?
@nebulon said in Orange circles in Services:
@subven interesting that it shows an "active" tooltip. Is this state consistent across page reloads?
Mostly yes, red circles vary after reload. Seems to be my local Chrome because it works with FF and on other machines with Chrome. Strg+F5 and deleting the local site data storage does not help. It's fine for me since its only cosmetic.
-
@subven I think this is some client side state race or so. Any information here in behavior can help
")
-
@nebulon I solved it. It was caused by one of my chrome addons (Dark Reader)
-
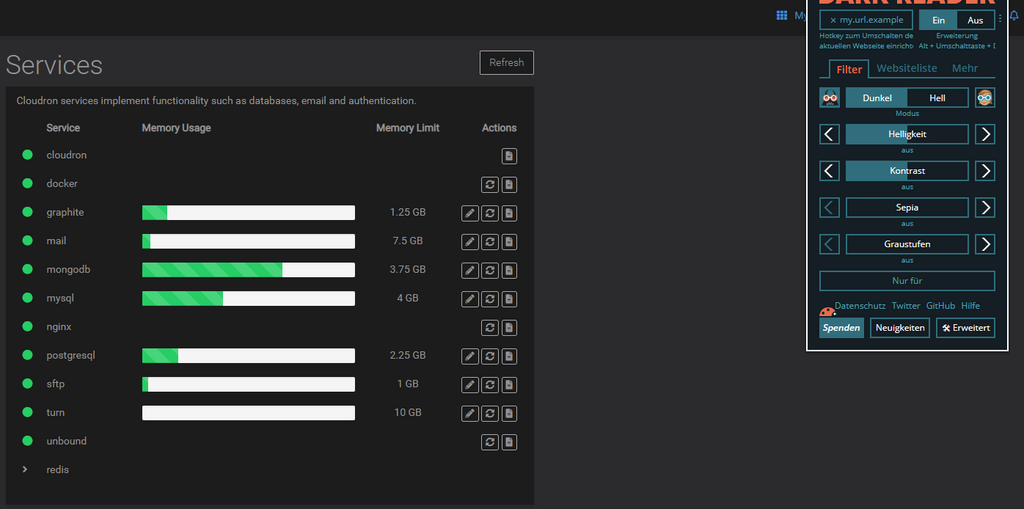
@robi regarding to what? I had a similiar issue than other users (multiple false positive red circles) and I fixed it by disabling a Chrome addon (Dark Reader) that alters page CSS. I can reproduce it by enabling the addon for the dashboard domain.
Dark Reader turned on:
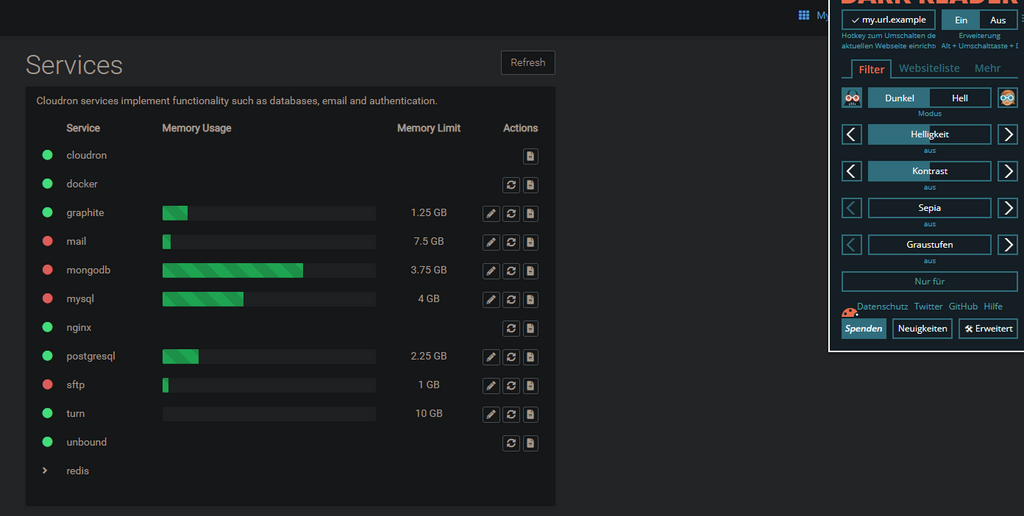
Dark Reader turned off:
-
@robi regarding to what? I had a similiar issue than other users (multiple false positive red circles) and I fixed it by disabling a Chrome addon (Dark Reader) that alters page CSS. I can reproduce it by enabling the addon for the dashboard domain.
Dark Reader turned on:
Dark Reader turned off:
-
@robi regarding to what? I had a similiar issue than other users (multiple false positive red circles) and I fixed it by disabling a Chrome addon (Dark Reader) that alters page CSS. I can reproduce it by enabling the addon for the dashboard domain.
Dark Reader turned on:
Dark Reader turned off:
@subven I think that may be specific to your use-case but it's still good to know it's fixed for you. I'm using Safari and have no extensions installed other than a password manager. Nothing that interferes with the webpage content. I've disabled some settings too as a result though to test further (like Safari's non-tracking features and stuff) but no difference in my case. I also use Mobile Safari where I see the issue and that has zero extensions on it at all.
I could be wrong, but I think the issue started around the time 6.1.2 came out. I'm not convinced this is a browser issue, although I think that's what @nebulon is suggesting if I understand him correctly.
@robi - in case this is indeed a browser / client-side issue (which I don't think it is personally), maybe note which browser you're using and accessing Cloudron on where you see this issue too in case it's Safari for both you and me. I suspect the behaviour @subven has seen is entirely separate from what you and I are reporting, judging by their comment on Feb 16th although admittedly similar in aspects.
--
Dustin Dauncey
www.d19.ca -
@subven I think that may be specific to your use-case but it's still good to know it's fixed for you. I'm using Safari and have no extensions installed other than a password manager. Nothing that interferes with the webpage content. I've disabled some settings too as a result though to test further (like Safari's non-tracking features and stuff) but no difference in my case. I also use Mobile Safari where I see the issue and that has zero extensions on it at all.
I could be wrong, but I think the issue started around the time 6.1.2 came out. I'm not convinced this is a browser issue, although I think that's what @nebulon is suggesting if I understand him correctly.
@robi - in case this is indeed a browser / client-side issue (which I don't think it is personally), maybe note which browser you're using and accessing Cloudron on where you see this issue too in case it's Safari for both you and me. I suspect the behaviour @subven has seen is entirely separate from what you and I are reporting, judging by their comment on Feb 16th although admittedly similar in aspects.
-
@d19dotca I also think that maybe that darkmode plugin just changes the timing and does not cause the race to hit badly.
-
@robi Is this the same server that had the etherpad issue? Because that one seems just fine here. I tried refreshing many times now, always green.
@girish
I, too, have several services from time to time indicating that they are starting though they seem to be running fine - such as mail in this example.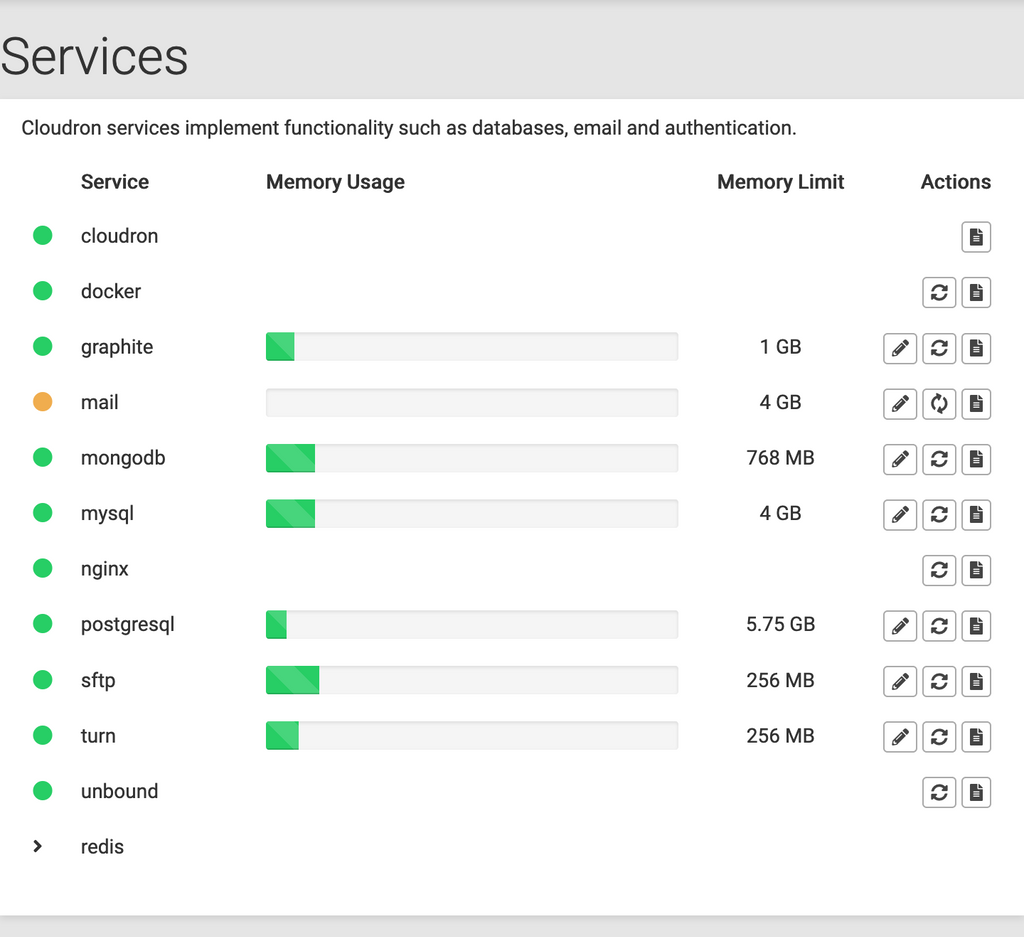
-
This is a very curious case. The tooltip of that status indicator is using the exact same property as the color. Both are not updated individually. So far I was not able to see how there could be some states out-of-sync if status is
active.I do see from the screenshots that the restart button also spins though, this indicates in some of those screenshots that the status is indeed
startingnotactivefor which the UI then seems to be consistent.This leads to a different question, if the service is actually running fine, why does the REST api then report
starting? From the code, this only happens if the upstream service instance (they live in their own container) fails to report status, while the container being up.Now to get more information, it would help if some of you, who can reproduce this, could take a look at the box logs at
/home/yellowtent/platformdata/logs/box.logwhile refreshing the dashboard. This should trigger a call to all the service containers and thus should hopefully give us more information. For example the call might just timeout or otherwise fail. -
This is a very curious case. The tooltip of that status indicator is using the exact same property as the color. Both are not updated individually. So far I was not able to see how there could be some states out-of-sync if status is
active.I do see from the screenshots that the restart button also spins though, this indicates in some of those screenshots that the status is indeed
startingnotactivefor which the UI then seems to be consistent.This leads to a different question, if the service is actually running fine, why does the REST api then report
starting? From the code, this only happens if the upstream service instance (they live in their own container) fails to report status, while the container being up.Now to get more information, it would help if some of you, who can reproduce this, could take a look at the box logs at
/home/yellowtent/platformdata/logs/box.logwhile refreshing the dashboard. This should trigger a call to all the service containers and thus should hopefully give us more information. For example the call might just timeout or otherwise fail.@nebulon After waking up a sleeping tab, I had graphite and mongo in orange. Graphite was spinning.
After reloading the services page, mongo went green. I then edited the graphite service and just saved. It then went green too.
these are the box logs.
2021-03-09T16:50:21.009Z box:translation Languages found: [ 'de.json', 'en.json', 'it.json', 'nl.json', 'zh_Hans.json' ] 2021-03-09T16:50:21.332Z box:apphealthmonitor app health: 21 alive / 1 dead. 2021-03-09T16:50:23.093Z box:shell statusUnbound exec: systemctl is-active unbound 2021-03-09T16:50:23.146Z box:shell statusNginx exec: systemctl is-active nginx 2021-03-09T16:50:23.178Z box:shell statusUnbound (stdout): active 2021-03-09T16:50:23.178Z box:shell statusUnbound (stderr): 2021-03-09T16:50:23.193Z box:shell statusNginx (stdout): active 2021-03-09T16:50:23.193Z box:shell statusNginx (stderr): 2021-03-09T16:50:31.262Z box:apphealthmonitor app health: 21 alive / 1 dead. 2021-03-09T16:50:41.027Z box:apphealthmonitor app health: 21 alive / 1 dead. 2021-03-09T16:50:50.875Z box:apphealthmonitor app health: 21 alive / 1 dead. 2021-03-09T16:50:59.971Z box:addons updateServiceConfig: graphite {"memoryLimit":268435456} 2021-03-09T16:51:00.038Z box:shell update(graphite) spawn: /usr/bin/docker update --memory 241172480 --memory-swap 268435456 graphite 2021-03-09T16:51:00.735Z box:apphealthmonitor app health: 21 alive / 1 dead. 2021-03-09T16:51:01.190Z box:shell update(graphite) (stdout): graphite 2021-03-09T16:51:10.840Z box:apphealthmonitor app health: 21 alive / 1 dead. -
This is a very curious case. The tooltip of that status indicator is using the exact same property as the color. Both are not updated individually. So far I was not able to see how there could be some states out-of-sync if status is
active.I do see from the screenshots that the restart button also spins though, this indicates in some of those screenshots that the status is indeed
startingnotactivefor which the UI then seems to be consistent.This leads to a different question, if the service is actually running fine, why does the REST api then report
starting? From the code, this only happens if the upstream service instance (they live in their own container) fails to report status, while the container being up.Now to get more information, it would help if some of you, who can reproduce this, could take a look at the box logs at
/home/yellowtent/platformdata/logs/box.logwhile refreshing the dashboard. This should trigger a call to all the service containers and thus should hopefully give us more information. For example the call might just timeout or otherwise fail.@nebulon If I refresh the page several time in a row, it seems to get them in sync again and they all show green. There were 3 orange when I first loaded it and even after about two refreshes. It seemed to take around 3 or more refreshes to get it all green again.
For what it's worth, the services are definitely running despite it showing the restart icon spinning. And that's the issue for me... if I were to trust the page when I first load it, it'd imply my mail server is never running, lol, which of course it is when I check the logs for the mail server (and the fact I've had no customer complaints on mail server not working).
Here's the logs and what I see after refreshing several times to when it became green again. Hopefully it helps. I can't make heads or tails of it myself, haha, mostly because I was expecting to see something like
statusMailbut don't see that anywhere, onlystatusNginxandstatusUnbound.2021-03-09T18:43:25.216Z box:shell statusUnbound exec: systemctl is-active unbound 2021-03-09T18:43:25.281Z box:shell statusUnbound (stdout): active 2021-03-09T18:43:25.284Z box:shell statusUnbound (stderr): 2021-03-09T18:43:25.285Z box:shell statusNginx exec: systemctl is-active nginx 2021-03-09T18:43:25.381Z box:shell statusNginx (stdout): active 2021-03-09T18:43:25.384Z box:shell statusNginx (stderr): 2021-03-09T18:43:30.373Z box:apphealthmonitor app health: 27 alive / 0 dead. 2021-03-09T18:43:40.235Z box:apphealthmonitor app health: 27 alive / 0 dead. 2021-03-09T18:43:50.289Z box:apphealthmonitor app health: 27 alive / 0 dead. 2021-03-09T18:43:58.377Z box:shell statusUnbound exec: systemctl is-active unbound 2021-03-09T18:43:58.389Z box:shell statusNginx exec: systemctl is-active nginx 2021-03-09T18:43:58.422Z box:shell statusUnbound (stdout): active 2021-03-09T18:43:58.422Z box:shell statusUnbound (stderr): 2021-03-09T18:43:58.425Z box:shell statusNginx (stdout): active 2021-03-09T18:43:58.425Z box:shell statusNginx (stderr): 2021-03-09T18:44:00.894Z box:apphealthmonitor app health: 27 alive / 0 dead. 2021-03-09T18:44:05.161Z box:shell statusUnbound exec: systemctl is-active unbound 2021-03-09T18:44:05.212Z box:shell statusNginx exec: systemctl is-active nginx 2021-03-09T18:44:05.234Z box:shell statusUnbound (stdout): active 2021-03-09T18:44:05.234Z box:shell statusUnbound (stderr): 2021-03-09T18:44:05.270Z box:shell statusNginx (stdout): active 2021-03-09T18:44:05.270Z box:shell statusNginx (stderr): 2021-03-09T18:44:08.914Z box:shell statusUnbound exec: systemctl is-active unbound 2021-03-09T18:44:08.936Z box:shell statusNginx exec: systemctl is-active nginx 2021-03-09T18:44:08.958Z box:shell statusUnbound (stdout): active 2021-03-09T18:44:08.958Z box:shell statusUnbound (stderr): 2021-03-09T18:44:08.961Z box:shell statusNginx (stdout): active 2021-03-09T18:44:08.961Z box:shell statusNginx (stderr): 2021-03-09T18:44:10.812Z box:shell statusUnbound exec: systemctl is-active unbound 2021-03-09T18:44:10.826Z box:shell statusNginx exec: systemctl is-active nginx 2021-03-09T18:44:10.858Z box:shell statusUnbound (stdout): active 2021-03-09T18:44:10.859Z box:shell statusUnbound (stderr): 2021-03-09T18:44:10.869Z box:shell statusNginx (stdout): active 2021-03-09T18:44:10.869Z box:shell statusNginx (stderr):And when I refresh the page again just now (after it was all green) it went orange again. Here are the logs when I refreshed and it went orange again...
2021-03-09T18:49:30.135Z box:apphealthmonitor app health: 27 alive / 0 dead.
2021-03-09T18:49:31.977Z box:shell statusUnbound exec: systemctl is-active unbound
2021-03-09T18:49:32.004Z box:shell statusNginx exec: systemctl is-active nginx
2021-03-09T18:49:32.034Z box:shell statusUnbound (stdout): active

2021-03-09T18:49:32.034Z box:shell statusUnbound (stderr):
2021-03-09T18:49:32.069Z box:shell statusNginx (stdout): active

2021-03-09T18:49:32.070Z box:shell statusNginx (stderr):
2021-03-09T18:49:40.225Z box:apphealthmonitor app health: 27 alive / 0 dead.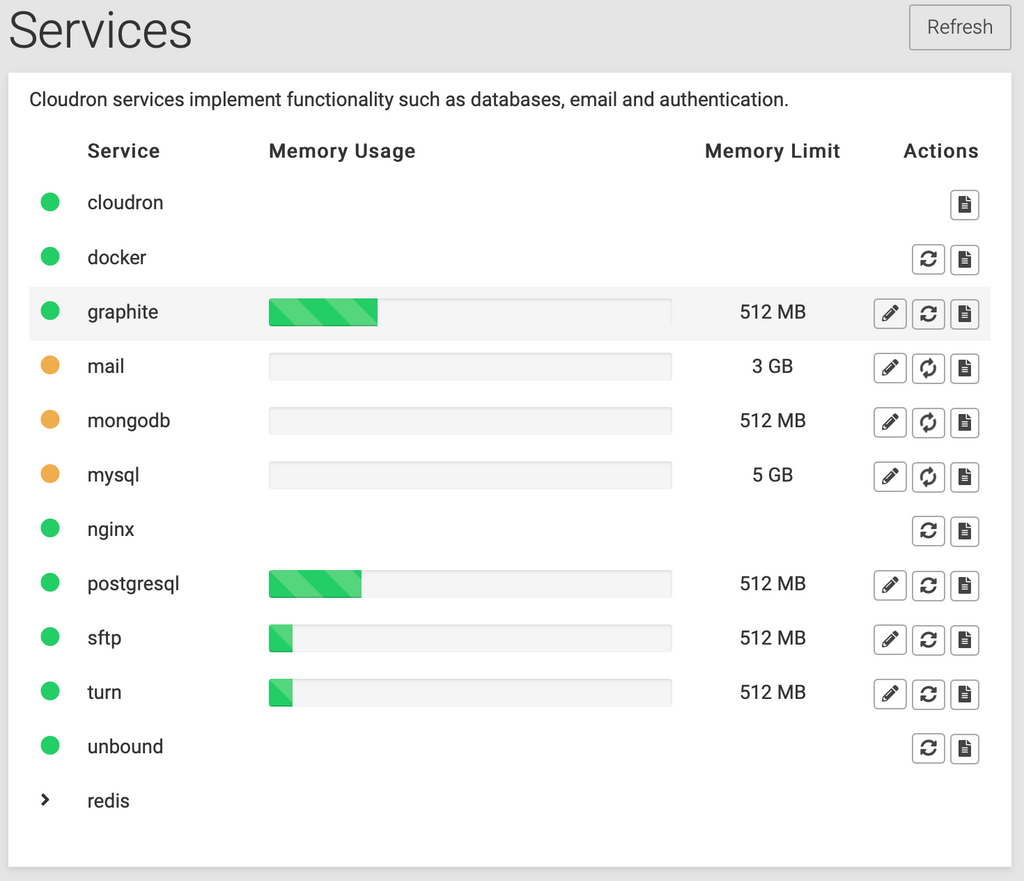
-
This is a very curious case. The tooltip of that status indicator is using the exact same property as the color. Both are not updated individually. So far I was not able to see how there could be some states out-of-sync if status is
active.I do see from the screenshots that the restart button also spins though, this indicates in some of those screenshots that the status is indeed
startingnotactivefor which the UI then seems to be consistent.This leads to a different question, if the service is actually running fine, why does the REST api then report
starting? From the code, this only happens if the upstream service instance (they live in their own container) fails to report status, while the container being up.Now to get more information, it would help if some of you, who can reproduce this, could take a look at the box logs at
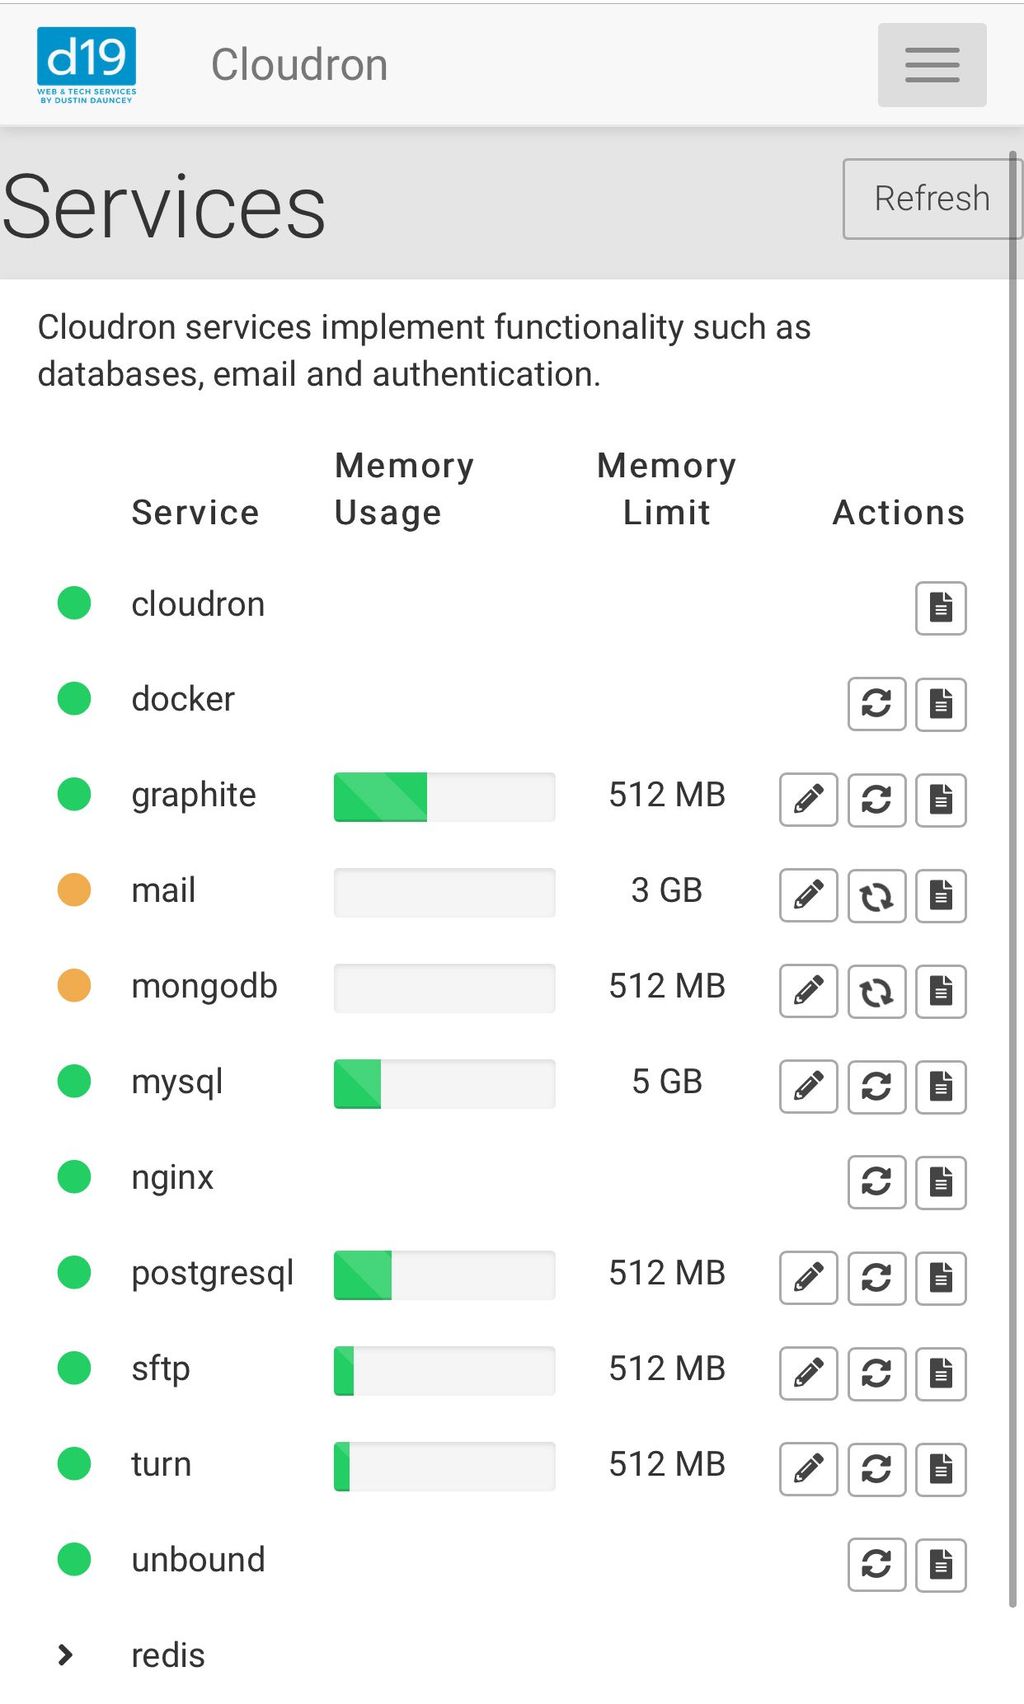
/home/yellowtent/platformdata/logs/box.logwhile refreshing the dashboard. This should trigger a call to all the service containers and thus should hopefully give us more information. For example the call might just timeout or otherwise fail.@nebulon If it helps, I took a screen recording of the Services page with the logs beside it, and refreshed several times. This time I wasn't able to get them all green at one time no matter how many refreshes were done or how quickly they were done.
You'll also see in the video that it's kind of random which ones are orange. Generally it's between a few of them, but every refresh isn't the same outcome. Out of 5 possibly orange for example, it'll be maybe 2 orange the next refresh, then 3 the next refresh, then 1 the next one, etc.
Here's the download link for the video, hopefully this helps:
https://files.d19.ca/Orange%20circles%20movie%20refreshing%20with%20logs.movOne thing (and why I think this isn't a browser issue and is a Cloudron issue) is that the ones that are orange always seem to be the same. For example, I've personally never noticed the
sftpone ever being orange norunboundnornginx. It's only evermail,mongodb,mysql,postgresqlin my case (I may be missing one).--
Dustin Dauncey
www.d19.ca
Hello! It looks like you're interested in this conversation, but you don't have an account yet.
Getting fed up of having to scroll through the same posts each visit? When you register for an account, you'll always come back to exactly where you were before, and choose to be notified of new replies (either via email, or push notification). You'll also be able to save bookmarks and upvote posts to show your appreciation to other community members.
With your input, this post could be even better 💗
Register Login