netdata - real-time monitoring
-
-
I would be delighted to see Netdata in Cloudron.
I have been using Netdata for many years now for about 50 servers.
My experience:
Netdata is a great tool for analysing the load on a machine, in real time or in the aftermath of a problem. Netdata itself is relatively resource-efficient.
Initially, I was irritated by the fact that the UI is very much geared towards using netdata.cloud. For example, there is a conspicuous "log in" button that takes you directly to the cloud (which has been payable for a few months now). Once you have registered the agent there, it is not so easy to get it out.
What is perhaps not so clear from the documentation is that the agent to be installed on the client can also act as a master and collect data from many clients. And completely without netdata.cloud.
As the Netdata UI is publicly accessible in the opensource version, protection via proxy is recommended, similar to https://learn.netdata.cloud/docs/netdata-agent/configuration/running-the-netdata-agent-behind-a-reverse-proxy/nginxHowever, the question for me is in what context Netdata should be integrated into Cloudron. As an agent in the apps? As an agent on the host system? As a "monitoring master" app to monitor other servers/containers?
-
There is no difference between the agent and master, the binaries are the same.
I don't see the point to differentiate usage between master and agent only as it is only some configuration changes.
By default the agent monitor the Cloudron server, and if you add the correct configuration it then become a parent node centralizing all your other nodes -
@cvachery there are a lot of issues in the app. Or maybe it's the package. I don't have enough working knowledge of netdata to understand where the fault lies.
Here's some issues:
-
The login button is there on top right even after login. We were willing to look past this. https://github.com/netdata/netdata/issues/9362 is the issue upstream, I think.
-
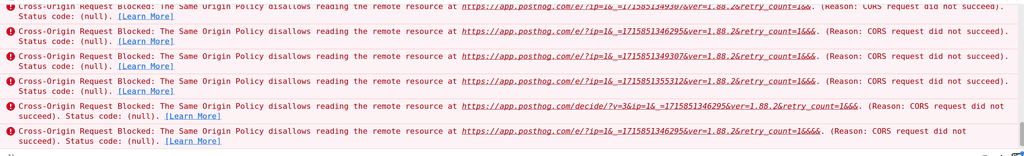
After you login, the app is continuously sending analytics data to some external service. There is no way to turn this off afaict.
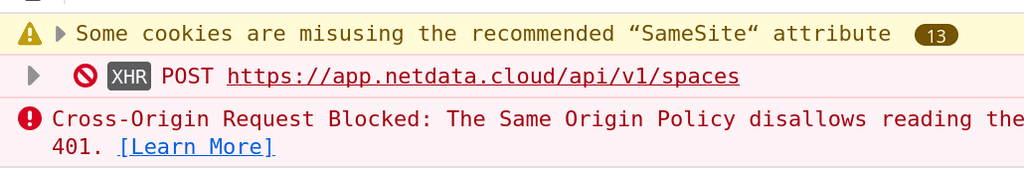
- Creating a space fails because it is sending the request to Netdata Cloud again.
- To add a node, again it says go to cloud.
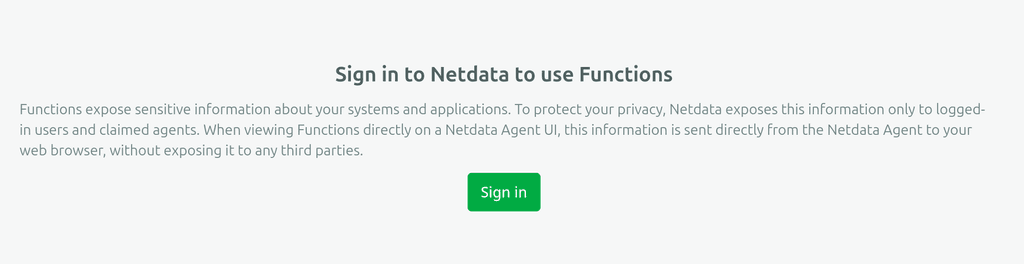
- To use functions, needs sign in and needs cloud.
So anyway, after all this, I bit the bullet and signed up at
https://app.netdata.cloud/because otherwise there is nothing much to do in the app. The app is the exact same in the cloud already.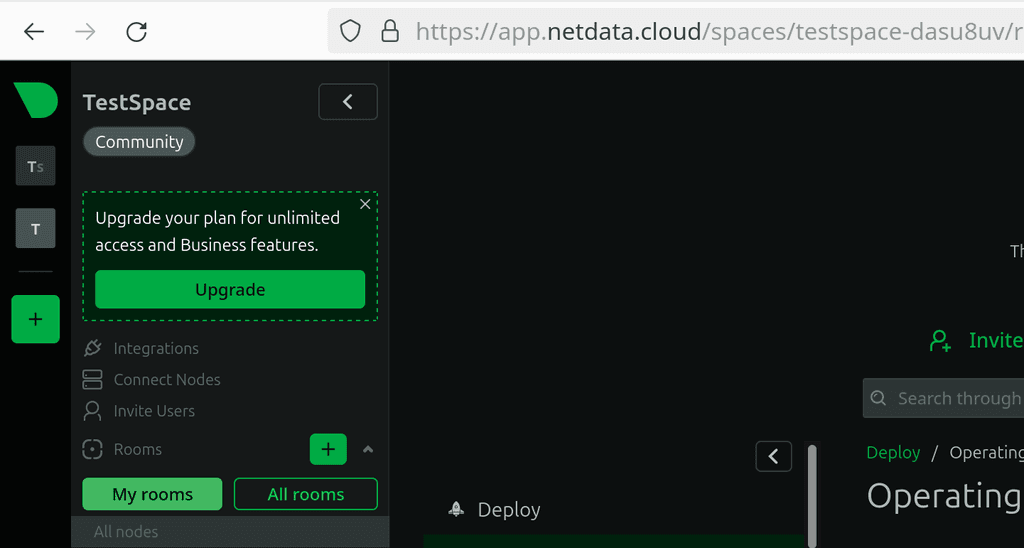
I think we have to take a step back to understand what is the advantage and purpose of selfhosting this. Nothing is stored in the database and the local directories atleast. It's all stored in the cloud.
For me, the cloud sign up is OK (it's not Cloudron.io's decision to decide upstream app workflows). But it seem everything is stored in the cloud service , defeating the purpose of selfhosting. The app is basically just hosting a front end to the cloud. It's like the youtube/twitter frontends. Except unlike the "alternate" frontends, the one in cloud and one selfhosted is the exact same. This could all be a big misunderstanding from me...
-
-
I would also first try to better understand if this is more like a self-hosted node to provide data to a dashboard, which is mostly designed to run on the netdata saas cloud, or if the self-hosted dashboard is more a thing of the past. A bit like with what unifi/ubiquity did, where the locally run dashboard is more and more just the legacy product.
-
OK, reading more now, it seems that this could be an agent (I guess this is what @simon was saying/asking in https://forum.cloudron.io/post/86581). The agent has a dashboard but of course much of it is not working because the dashboard is being coded for the cloud service. Since Cloudron apps are sandboxed and don't have access to other containers/apps/server stuff, it cannot monitor correctly. Ideally, it needs connection to docker and also the SYS_PTRACE and SYS_ADMIN caps (per https://www.netdata.cloud/integrations/deploy/docker-kubernetes/docker/)
-
For the telemetry stuff https://learn.netdata.cloud/docs/netdata-agent/configuration/anonymous-telemetry-events could be helpful.
There is also a discussion I could find where they talk about disabling the links to the netdata cloud: https://community.netdata.cloud/t/disable-cloud-nags/2985
-
Yes exactly, that's what I described above. Everything goes to the Netdata cloud! This is very confusing at first. However, as I said, you can still run Netdata as a master node and then carry out the analysis for many agents in one place. However, I still use the old UI for this, which can be called up with monitoringmaster-example.com/v1/. Here you then have a sidebar and can call up the individual nodes. As I want to monitor individual servers and not a connected server farm, this exactly covers my use case.
But back to the Cloudron use case.
As mentioned above, I see two possibilities:- the app is used to monitor the Cloudron server/hardware. That would already do a lot: Hard drive, ram etc. there is also a Docker plugin which provides various insights into the containers running on the machine.
- the use case described above: the app is a masternode and receives the metrics from child nodes (any web server). The advantage would be that you have the monitoring in one place and do not have to use the Netdata Cloud. Compared to a self-installation, another advantage would be that I could clarify the security (htpasswd?).
@simon yes, thanks for the clarification.
About Option 2: from what I can tell, netdata appears to move away from the v1 dashboard. https://github.com/netdata/dashboard has marked it as deprecated . There is also no way to default to v1 (https://community.netdata.cloud/t/configure-netdata-to-use-the-old-dashboards-v1-by-default/4511) . It seems the workflow for a Cloudron user is install the app, ignore everything each time they visit the main app page and go through a specific URL to access deprecated software. Don't think we can maintain this as a package in the long run.
Option 1: Netdata integration will be nice, agreed. I think this is also being discussed at https://forum.cloudron.io/topic/7858/any-issues-with-including-netdata-on-the-root-server-and-as-an-app-add-on/ . If we support that, it will more like an addon and not as an app though. We don't like apps that can access the host (JupyterHub is really the main exception here). Apps are self contained and containerized things that we can open to 3rd party and people can install without worrying much about consequences. Addons are the containers we develop and maintain as part of Cloudron itself. This is also why we don't have CI apps on Cloudron. We don't want apps to run random containers and access all the containers.
-
@simon yes, thanks for the clarification.
About Option 2: from what I can tell, netdata appears to move away from the v1 dashboard. https://github.com/netdata/dashboard has marked it as deprecated . There is also no way to default to v1 (https://community.netdata.cloud/t/configure-netdata-to-use-the-old-dashboards-v1-by-default/4511) . It seems the workflow for a Cloudron user is install the app, ignore everything each time they visit the main app page and go through a specific URL to access deprecated software. Don't think we can maintain this as a package in the long run.
Option 1: Netdata integration will be nice, agreed. I think this is also being discussed at https://forum.cloudron.io/topic/7858/any-issues-with-including-netdata-on-the-root-server-and-as-an-app-add-on/ . If we support that, it will more like an addon and not as an app though. We don't like apps that can access the host (JupyterHub is really the main exception here). Apps are self contained and containerized things that we can open to 3rd party and people can install without worrying much about consequences. Addons are the containers we develop and maintain as part of Cloudron itself. This is also why we don't have CI apps on Cloudron. We don't want apps to run random containers and access all the containers.
I understand what you mean, basically these are exactly the points I suspected at the beginning.
However, I probably expressed myself incorrectly in option 2. You can also operate a master with the current UI that displays all nodes together or individually. That's quite a lot! You get very detailed and precise information about what is currently running (or not) on a server. The alarms are also very helpful. You can manage them centrally with a central node. Hard disks or SWAP that are full, RAM problems and even DDos can be recognised.
However, you have to live with the fact that the login button goes to the cloud and functions such as the war rooms only work there. This is somewhat confusing and could be unsatisfactory for Cloudron users.So my conclusion: this can make sense on Cloudron. It is a popular tool and, in my opinion, one of the best in the area of server monitoring. I would use the app.
Option 1:
you could of course also treat the Cloudron server as a child node. Then the app has no direct access to the host system. Simply install the agent normally on the shell and have the metrics delivered to a possible app (option 2). This would just be option 2 + two lines in the documentation. -
I understand what you mean, basically these are exactly the points I suspected at the beginning.
However, I probably expressed myself incorrectly in option 2. You can also operate a master with the current UI that displays all nodes together or individually. That's quite a lot! You get very detailed and precise information about what is currently running (or not) on a server. The alarms are also very helpful. You can manage them centrally with a central node. Hard disks or SWAP that are full, RAM problems and even DDos can be recognised.
However, you have to live with the fact that the login button goes to the cloud and functions such as the war rooms only work there. This is somewhat confusing and could be unsatisfactory for Cloudron users.So my conclusion: this can make sense on Cloudron. It is a popular tool and, in my opinion, one of the best in the area of server monitoring. I would use the app.
Option 1:
you could of course also treat the Cloudron server as a child node. Then the app has no direct access to the host system. Simply install the agent normally on the shell and have the metrics delivered to a possible app (option 2). This would just be option 2 + two lines in the documentation.@simon said in netdata - real-time monitoring:
You can also operate a master with the current UI that displays all nodes together or individually
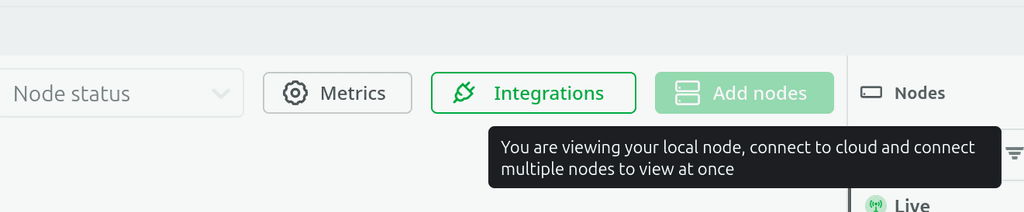
Ah ok. How does one do this? See my third screenshot in https://forum.cloudron.io/post/88560. The add node button was disabled and it asks me to go to the cloud.
-
@simon said in netdata - real-time monitoring:
You can also operate a master with the current UI that displays all nodes together or individually
Ah ok. How does one do this? See my third screenshot in https://forum.cloudron.io/post/88560. The add node button was disabled and it asks me to go to the cloud.
@girish said in netdata - real-time monitoring:
The add node button was disabled and it asks me to go to the cloud.
This is also part of the dark pattern. If you are logged into the cloud, you will find instructions on how to add nodes behind this button.
As far as I understand it correctly (I wouldn't call myself a professional either!), Netdata basically works as follows:
There is ONE application that can:- monitor its own host system and output the result on a web interface. This is the case that you obviously have on your computer now.
- alternatively, every Netdata application can also send data (additionally or exclusively) to other nodes. This is where Netdata's advertising comes in. If you want more than an unsecured output via port 19999 on the system to be monitored, you should preferably go to the cloud and pay! But it also works without a paid cloud, just not as convincingly.
- or the Netdata installation acts as the master (or parent node) processes the data from other nodes (child nodes). In other words, it can display, act, send alarms, etc. That would be the variant that I could very well imagine as a Cloudron app. In this case, however, the child nodes are not added via the UI of the master, but via an entry in stream.conf on the sending Netdata. As soon as the master receives data, the UI changes slightly and you can switch between different nodes.
This is explained quite clearly at https://www.netdata.cloud/blog/netdata-parents-streaming-replication/.
It is also important to know that Netdata should always run behind a proxy: https://learn.netdata.cloud/docs/netdata-agent/configuration/running-the-netdata-agent-behind-a-reverse-proxy/
-
and to mention it again: a Netdata installation could run in the OS of the Cloudron host system like on any other server, which sends metrics to a Netdata Cloudron app via a configured stream.conf. In this case, everything would remain isolated. But of course you would have to test it!
-
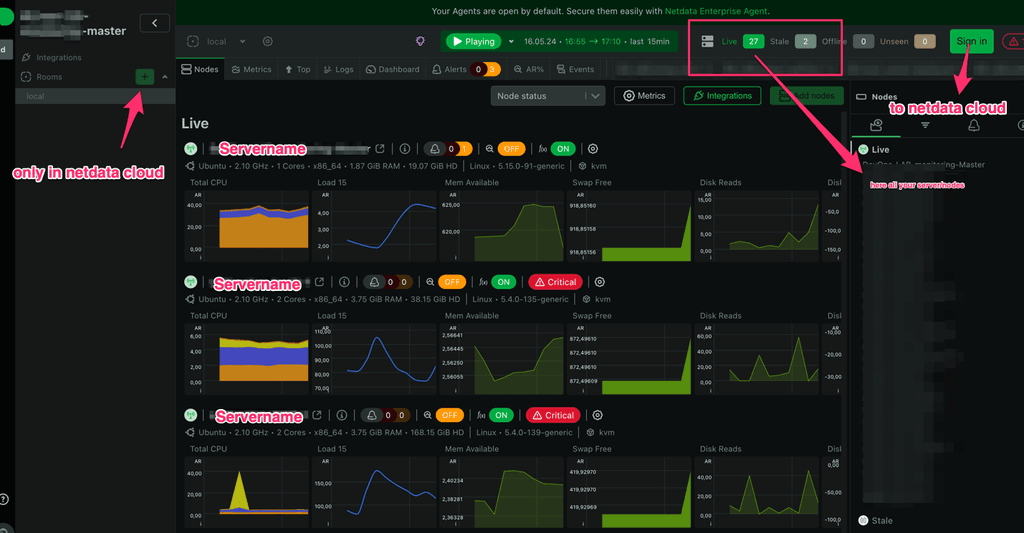
When you self-host like this you can't use the
add nodefeature orsign inbutton as those as netdata cloud only as @simon said.
But you can configure your nodes to stream their metrics to your master node and therefore have a centralized node with all your metrics. I'm using the v2 of the Web-UI and don't have any issue with it so far.
And what is not shown in simon screenshot (well it is the blurred part right under thesign-inbutton) is that you can have a more detailed view for each of your node too.I don't say that netdata must be use for the monitoring of the Cloudron host (even if it kinda works by default) as I understand that you don't want app accessing the host (but the agent could be installed and stream to a master node/cloud if people want), but it is a great tool to have to monitor all the other servers of your infra and will be very nice to have on Cloudron.
-
Alright, we have to revisit this app later. There's more important apps in the pipeline and those are more focused on selfhosting. We have limited experience with netdata to jump though all cloud functionality. The immediate questions after installing this app are - a) the buttons don't work b) how do I configure Cloudron to use this dashboard. Neither work and we don't have a real answer to this other than a lengthy POSTINSTALL informing the user that things don't work and/or pointing to this forum thread. We actually asked a couple of people outside our company about the app and they didn't get it either. I understand power users would like this.
For the power users, they can install with the CLI tool without building -
cloudron install --image cloudron/cloud.netdata.cloudronapp:20240516-122253-039c28664for the moment. When Cloudron itslef supports netdata, we can look into somehow having the package atleast work with Cloudron host. -
Netdata is king! I'm running an instance on a RaspberryPi4 and it's working great!
Hello! It looks like you're interested in this conversation, but you don't have an account yet.
Getting fed up of having to scroll through the same posts each visit? When you register for an account, you'll always come back to exactly where you were before, and choose to be notified of new replies (either via email, or push notification). You'll also be able to save bookmarks and upvote posts to show your appreciation to other community members.
With your input, this post could be even better 💗
Register Login