New set of alerts in my log after getting red pop alerts covering my window
-
I reckon these two errors are connected to the red alerts I've suddenly been getting. This, plus the fact that I also keep getting warnings about the cloudron reaching it's resource limit (I have 24GB ram but none of the memory graphs show any total getting even near 5GB), might have something to do with the red warnings.
Jun 08 09:15:04 15:M 08 Jun 07:15:04.776 # WARNING overcommit_memory is set to 0! Background save may fail under low memory condition. To fix this issue add 'vm.overcommit_memory = 1' to /etc/sysctl.conf and then reboot or run the command 'sysctl vm.overcommit_memory=1' for this to take effect.
Jun 08 09:15:04 15:M 08 Jun 07:15:04.777 # WARNING you have Transparent Huge Pages (THP) support enabled in your kernel. This will create latency and memory usage issues with Redis. To fix this issue run the command 'echo never > /sys/kernel/mm/transparent_hugepage/enabled' as root, and add it to your /etc/rc.local in order to retain the setting after a reboot. Redis must be restarted after THP is disabled.
Should I do the two suggested fixes here?
-
Hi,
Thank you for replying. That is good to know what those lines mean, but if they are connected to the red alerts can I do anything about it? These red alert pop-ups can cover my entire screen at times and I have to click each one to make them disappear.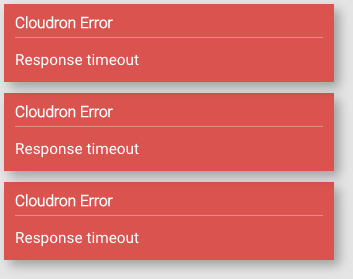
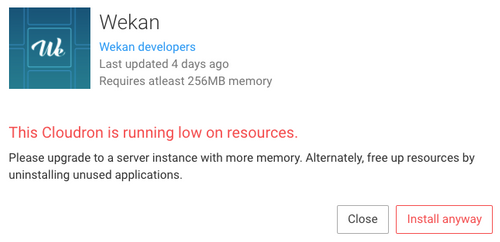
The installation warning just tells me that I need a server with more memory, but like I said, none of the graphs ever show my apps going above 2GB, most between 250 and 500 MB... I have a feeling the red alerts are related to this.
A life lived in fear is a life half-lived
-
Hi,
Thank you for replying. That is good to know what those lines mean, but if they are connected to the red alerts can I do anything about it? These red alert pop-ups can cover my entire screen at times and I have to click each one to make them disappear.The installation warning just tells me that I need a server with more memory, but like I said, none of the graphs ever show my apps going above 2GB, most between 250 and 500 MB... I have a feeling the red alerts are related to this.
-
@scooke You can see total memory usage in the "System" page, under the "System Memory" tab. How high is it ? Because yeah 24GB should be good for quite a few apps. How many have you got ?
@mehdi Hovering at just under 4GB.
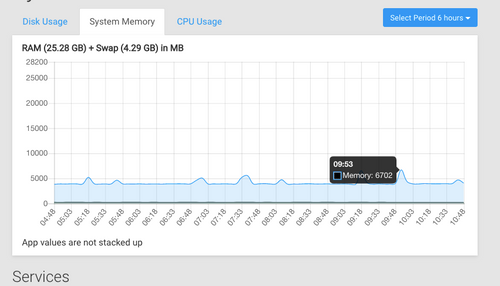 So It appears I have about 20GB left for the apps. My VPS dashboard tells me I'm using 8GB out of the 24GB, which tallies with the 4GB being used and the seeming total of all the other apps.
I have 34 apps installed! A few big ones would be NC, Pixel, Matrix and Riot, 3 Ghost apps and 10 WP, and Emby. But like I said, none of them ever go above 2GB at any time (I have checked by starting a process, like importing songs to Emby or Updating themes in WP, etc., and watching the memory dashboard and there just isn't ever any noticeable increase.
The total ram allocated for all these apps equals about 46GB (one app has 5888MB assigned and two have 4096MB assigned, 10 have 2048MB assigned, as examples - an earlier discussion I had either on Support or on Chat suggested that going over the physical RAM of the machine wouldn't automatically mean is affects overall performance in light of the fact that few of these ever reach their max allotted.
One WP site with 4096MB allotted, as an example, apparently hasn't used more than 36MB over the last 7 days, according to its graph. I suppose I could lower this one, and get rid of the Emby which has the 5888 allotted...
-
@scooke The warning appears when you just add up allocated RAM for all apps and see if it's sort of near the system RAM. It's just a frontend/UI check, the backend will happily install how many ever apps you want as long as you think the system can handle it. So, you can ignore that warning if you think there is enough memory available.
@girish Hi again, apologies for not posting more detail about the red pop ups. They have continued. I logged on to my cloudron this morning and my screen was covered with them, and I had to manually click on each to remove them. I found what appears to be a connected error in the logs. I'll share both a screen shot of all the red alerts, and the logs, here. If it is a matter of increasing ram for a redis node, that is fine but I have no idea which redis! Clicking 30 times is not the end of the world, but it is a little bothersome after awhile.
If these red pop-ups are simple warnings of the added-up allocated ram, is there a way to change the warning? The associated log entry doesn't read to me like it has been adding memory up; it looks like some connection is failing. Thanks for the help.Jun 11 10:32:16 ERROR ServiceUnavailableError: Response timeout at IncomingMessage.<anonymous> (/home/yellowtent/box/node_modules/connect-timeout/index.js:84:8) at IncomingMessage.emit (events.js:198:13) at Timeout.<anonymous> (/home/yellowtent/box/node_modules/connect-timeout/index.js:49:11) at ontimeout (timers.js:436:11) at tryOnTimeout (timers.js:300:5) at listOnTimeout (timers.js:263:5) at Timer.processTimers (timers.js:223:10) [ /home/yellowtent/box/node_modules/express/lib/application.js:630:43 ]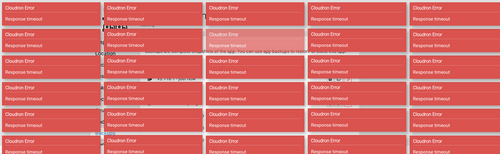
-
This looks like the main Cloudron process is not responding in time. This either is an issue that the server itself is too busy. Can you open up the webinspector in the browser when that happens to see, which REST api call fails as well as do you see further hints in the logs?
less /home/yellowtent/platformdata/logs/box.login this case -
This looks like the main Cloudron process is not responding in time. This either is an issue that the server itself is too busy. Can you open up the webinspector in the browser when that happens to see, which REST api call fails as well as do you see further hints in the logs?
less /home/yellowtent/platformdata/logs/box.login this case@nebulon said in New set of alerts in my log after getting red pop alerts covering my window:
At the moment there are lines after lines after lines of:
Jun 11 15:03:43 box:ldap user search: dn ou=users, dc=cloudron, scope sub, filter (&(|(objectclass=user))(displayname=*)(|(displayname=*)(mail=*))) (from 172.18.0.47:34340)
I don't recall seeing this repeated like this before. -
@nebulon said in New set of alerts in my log after getting red pop alerts covering my window:
At the moment there are lines after lines after lines of:
Jun 11 15:03:43 box:ldap user search: dn ou=users, dc=cloudron, scope sub, filter (&(|(objectclass=user))(displayname=*)(|(displayname=*)(mail=*))) (from 172.18.0.47:34340)
I don't recall seeing this repeated like this before. -
-
@scooke If there are really a lot of these lines in a very short time, maybe one of your apps is under DDoS attack ? Or someone is trying to brute-force a password ?
Hello! It looks like you're interested in this conversation, but you don't have an account yet.
Getting fed up of having to scroll through the same posts each visit? When you register for an account, you'll always come back to exactly where you were before, and choose to be notified of new replies (either via email, or push notification). You'll also be able to save bookmarks and upvote posts to show your appreciation to other community members.
With your input, this post could be even better 💗
Register Login