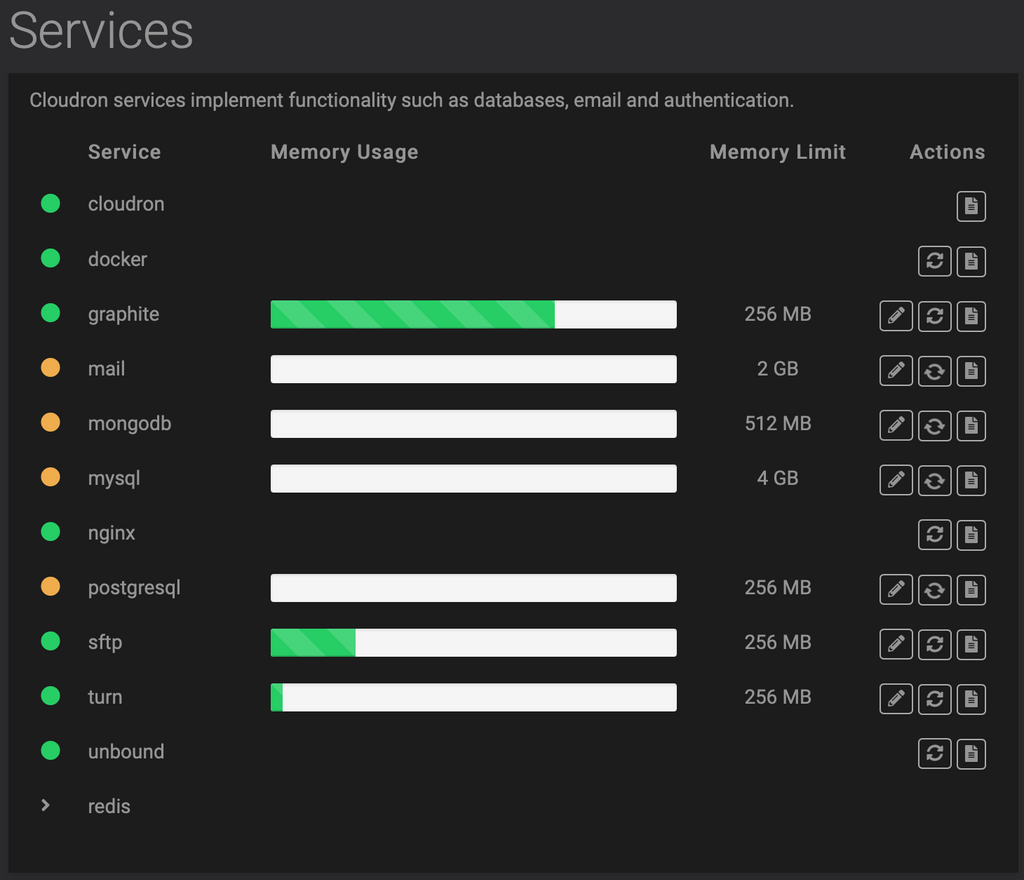
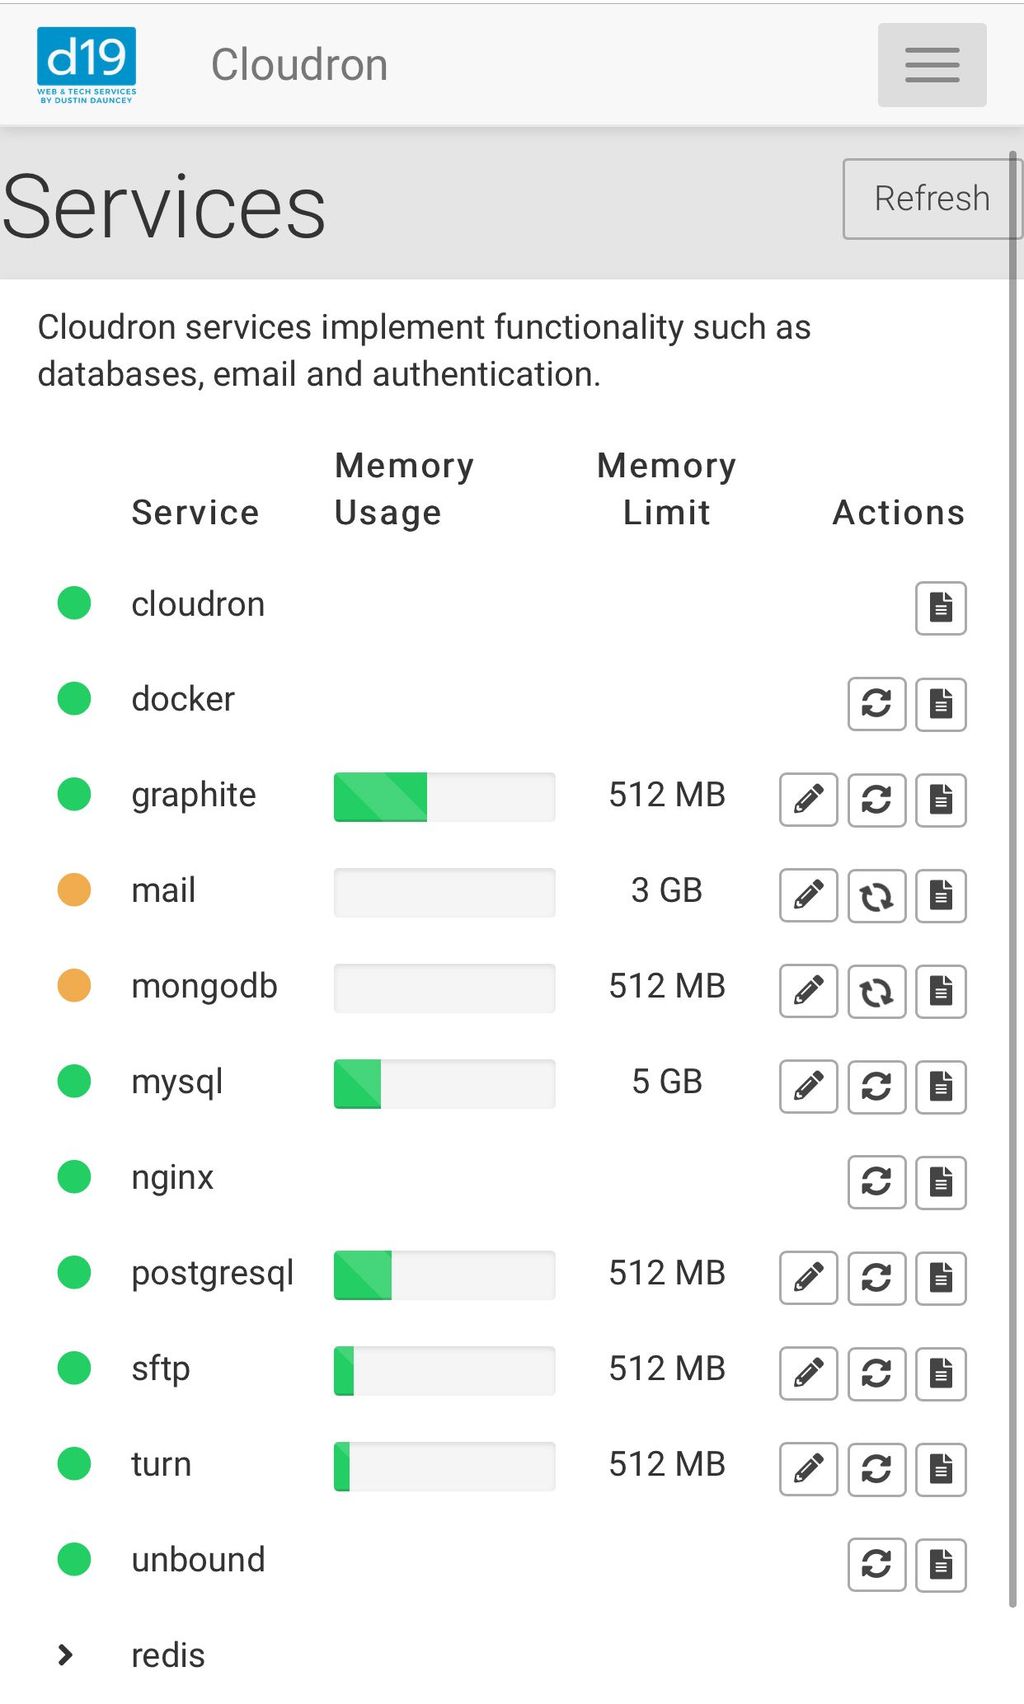
Orange circles in Services
-
graphite
mail
mongo
mysql
postgres
and in some cases..
redisSeveral of my cloudrons have after upgrade and browser refresh gone orange, somehow lost the state that the services have actually started and are running, as per their logs.
One can continue to maunally restart services to have them go green, or ..
Alternatively, edit the service configuration and clicking save with no changes for it to recognize it started and turn green.
Can you find the bug?
-
The orange thing means the services are starting up. Did you happen to capture any service logs when they were orange?
-
@girish The services are fine. No errors in logs.
The UI seems to not pick up that the services should be green. Until the above actions are taken.
-
I guess you're already aware of the UI issue, but saw this as I was about to report this too. Seems I have the exact same issue reported by @robi in terms of services affected as well.
I noticed in my Services tab today that several are continually in "starting" state even though they're actually operating properly and their logs can confirm it. While it says "starting", the service is actually running and should be green.
--
Dustin Dauncey
www.d19.ca -
I guess you're already aware of the UI issue, but saw this as I was about to report this too. Seems I have the exact same issue reported by @robi in terms of services affected as well.
I noticed in my Services tab today that several are continually in "starting" state even though they're actually operating properly and their logs can confirm it. While it says "starting", the service is actually running and should be green.
-
-
if this comes up again for one of you, can you open the webinspector's network tab and see if there are new requests happening to fetch the current service status and if so, can you dump maybe a few examples of the response body for investigation?
@nebulon I experienced something similar. Currently graphite, mail, mongodb and mysql appear orange. Here's the response for graphite, for example:
{
  "service": {
    "name": "graphite",
    "status": "starting",
    "error": "Error waiting for graphite: ESOCKETTIMEDOUT",
    "healthcheck": null,
    "config": {
      "memoryLimit": 268435456
    }
  }
}
Each time I refresh the page, it seems to be a lucky dip which of those come back as green and which as orange. e.g. a second time everything was green except mail, a third time mysql is orange again.
-
For what it's worth, I'm currently running on Ubuntu 20.04, not sure if that's making a difference at all since the add-on components would be running a different version I presume (i.e. MySQL, PostgreSQL, MongoDB, etc.), though I guess that doesn't necessarily make sense for the Mail service.
-
FWIW, I just checked my Services, and saw that mail and mongodb were orange. So I tweaked the memory just a tiny little bit (adding 124 MB), and the circle almost immediately went green. I don't know what that might add to the search, but if you want a green circle, this seems to be one way to get it!
-
Hmm I have a similar issue on a Cloudron (v6.1.2 and before) where random apps are stuck in "Starting" but apparently working/running as they should. Services however work just fine on this Cloudron.
This state is kinda permanent and restarting the app nor the server does not help. Also seems to be kinda random what app is affected but their numbers seem to grow. My other two Cloudrons are fine ^^
Log output as en example (for Element) is:
Feb 16 20:36:35 box:settings initCache: pre-load settings
Feb 16 20:36:35 box:taskworker Starting task 789. Logs are at /home/yellowtent/platformdata/logs/e0016eed-67a4-45dd-8234-642c8aee11d3/apptask.log
Feb 16 20:36:35 box:tasks 789: {"percent":2,"error":null}
Feb 16 20:36:35 box:apptask chat.heregoesthedomain.com startTask installationState: pending_restart runState: running
Feb 16 20:36:35 box:tasks 789: {"percent":20,"message":"Restarting container"}
Feb 16 20:36:35 http-server stopped.
Feb 16 20:36:36 ==> Starting Riot
Feb 16 20:36:36 box:tasks 789: {"percent":100,"message":"Done"}
Feb 16 20:36:36 box:apptask chat.heregoesthedomain.com updating app with values: {"installationState":"installed","error":null,"health":null}
Feb 16 20:36:36 box:taskworker Task took 1.109 seconds
Feb 16 20:36:36 box:tasks setCompleted - 789: {"result":null,"error":null}
Feb 16 20:36:36 box:tasks 789: {"percent":100,"result":null,"error":null}
Feb 16 20:36:36 Starting up http-server, serving /app/code
Feb 16 20:36:36 Available on:
Feb 16 20:36:36 http://127.0.0.1:3000
Feb 16 20:36:36 http://172.18.16.9:3000
Feb 16 20:36:36 Hit CTRL-C to stop the server
Feb 16 20:36:57 [2021-02-16T19:36:57.389Z] "GET /" "Mozilla/5.0 (Windows NT 10.0; Win64; x64) AppleWebKit/537.36 (KHTML, like Gecko) Chrome/88.0.4324.150 Safari/537.36"
PS: Sorry, not wanted to hijack this topic. I thought about opening an seperate issue for this but so far it was not that much of a problem and I hoped it would be fixed after the next update ^^
-
@subven I think the starting issue is something else. If you do
systemctl restart box, I think they will all become running again. Can you please try?@girish said in Orange circles in Services:
@subven I think the starting issue is something else. If you do
systemctl restart box, I think they will all become running again. Can you please try?Yes they are
") I was confused because even
I was confused because even box:apphealthmonitorsaid the apps are up. -
Kinda same for me. Freshly installed server + imported Cloudron 6.1.2 backup. The server the backup is from did not had the problem.
-
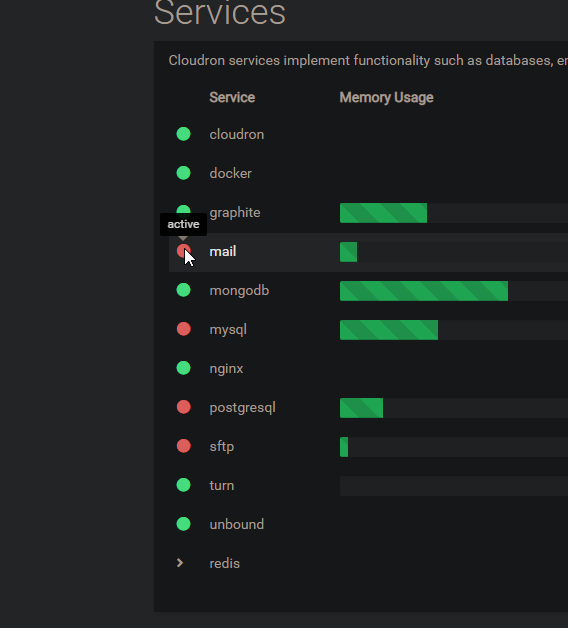
@subven interesting that it shows an "active" tooltip. Is this state consistent across page reloads?
@nebulon said in Orange circles in Services:
@subven interesting that it shows an "active" tooltip. Is this state consistent across page reloads?
Mostly yes, red circles vary after reload. Seems to be my local Chrome because it works with FF and on other machines with Chrome. Strg+F5 and deleting the local site data storage does not help. It's fine for me since its only cosmetic.
")
Hello! It looks like you're interested in this conversation, but you don't have an account yet.
Getting fed up of having to scroll through the same posts each visit? When you register for an account, you'll always come back to exactly where you were before, and choose to be notified of new replies (either via email, or push notification). You'll also be able to save bookmarks and upvote posts to show your appreciation to other community members.
With your input, this post could be even better 💗
Register Login