Cloudron performance issues


-
Current configuration of things:
- Cloudron DO Server: 16GB RAM / 8 Intel CPU / Ubuntu 22.04
Issue:
- Certain apps keep running out of memory. Currently, it's metabase:

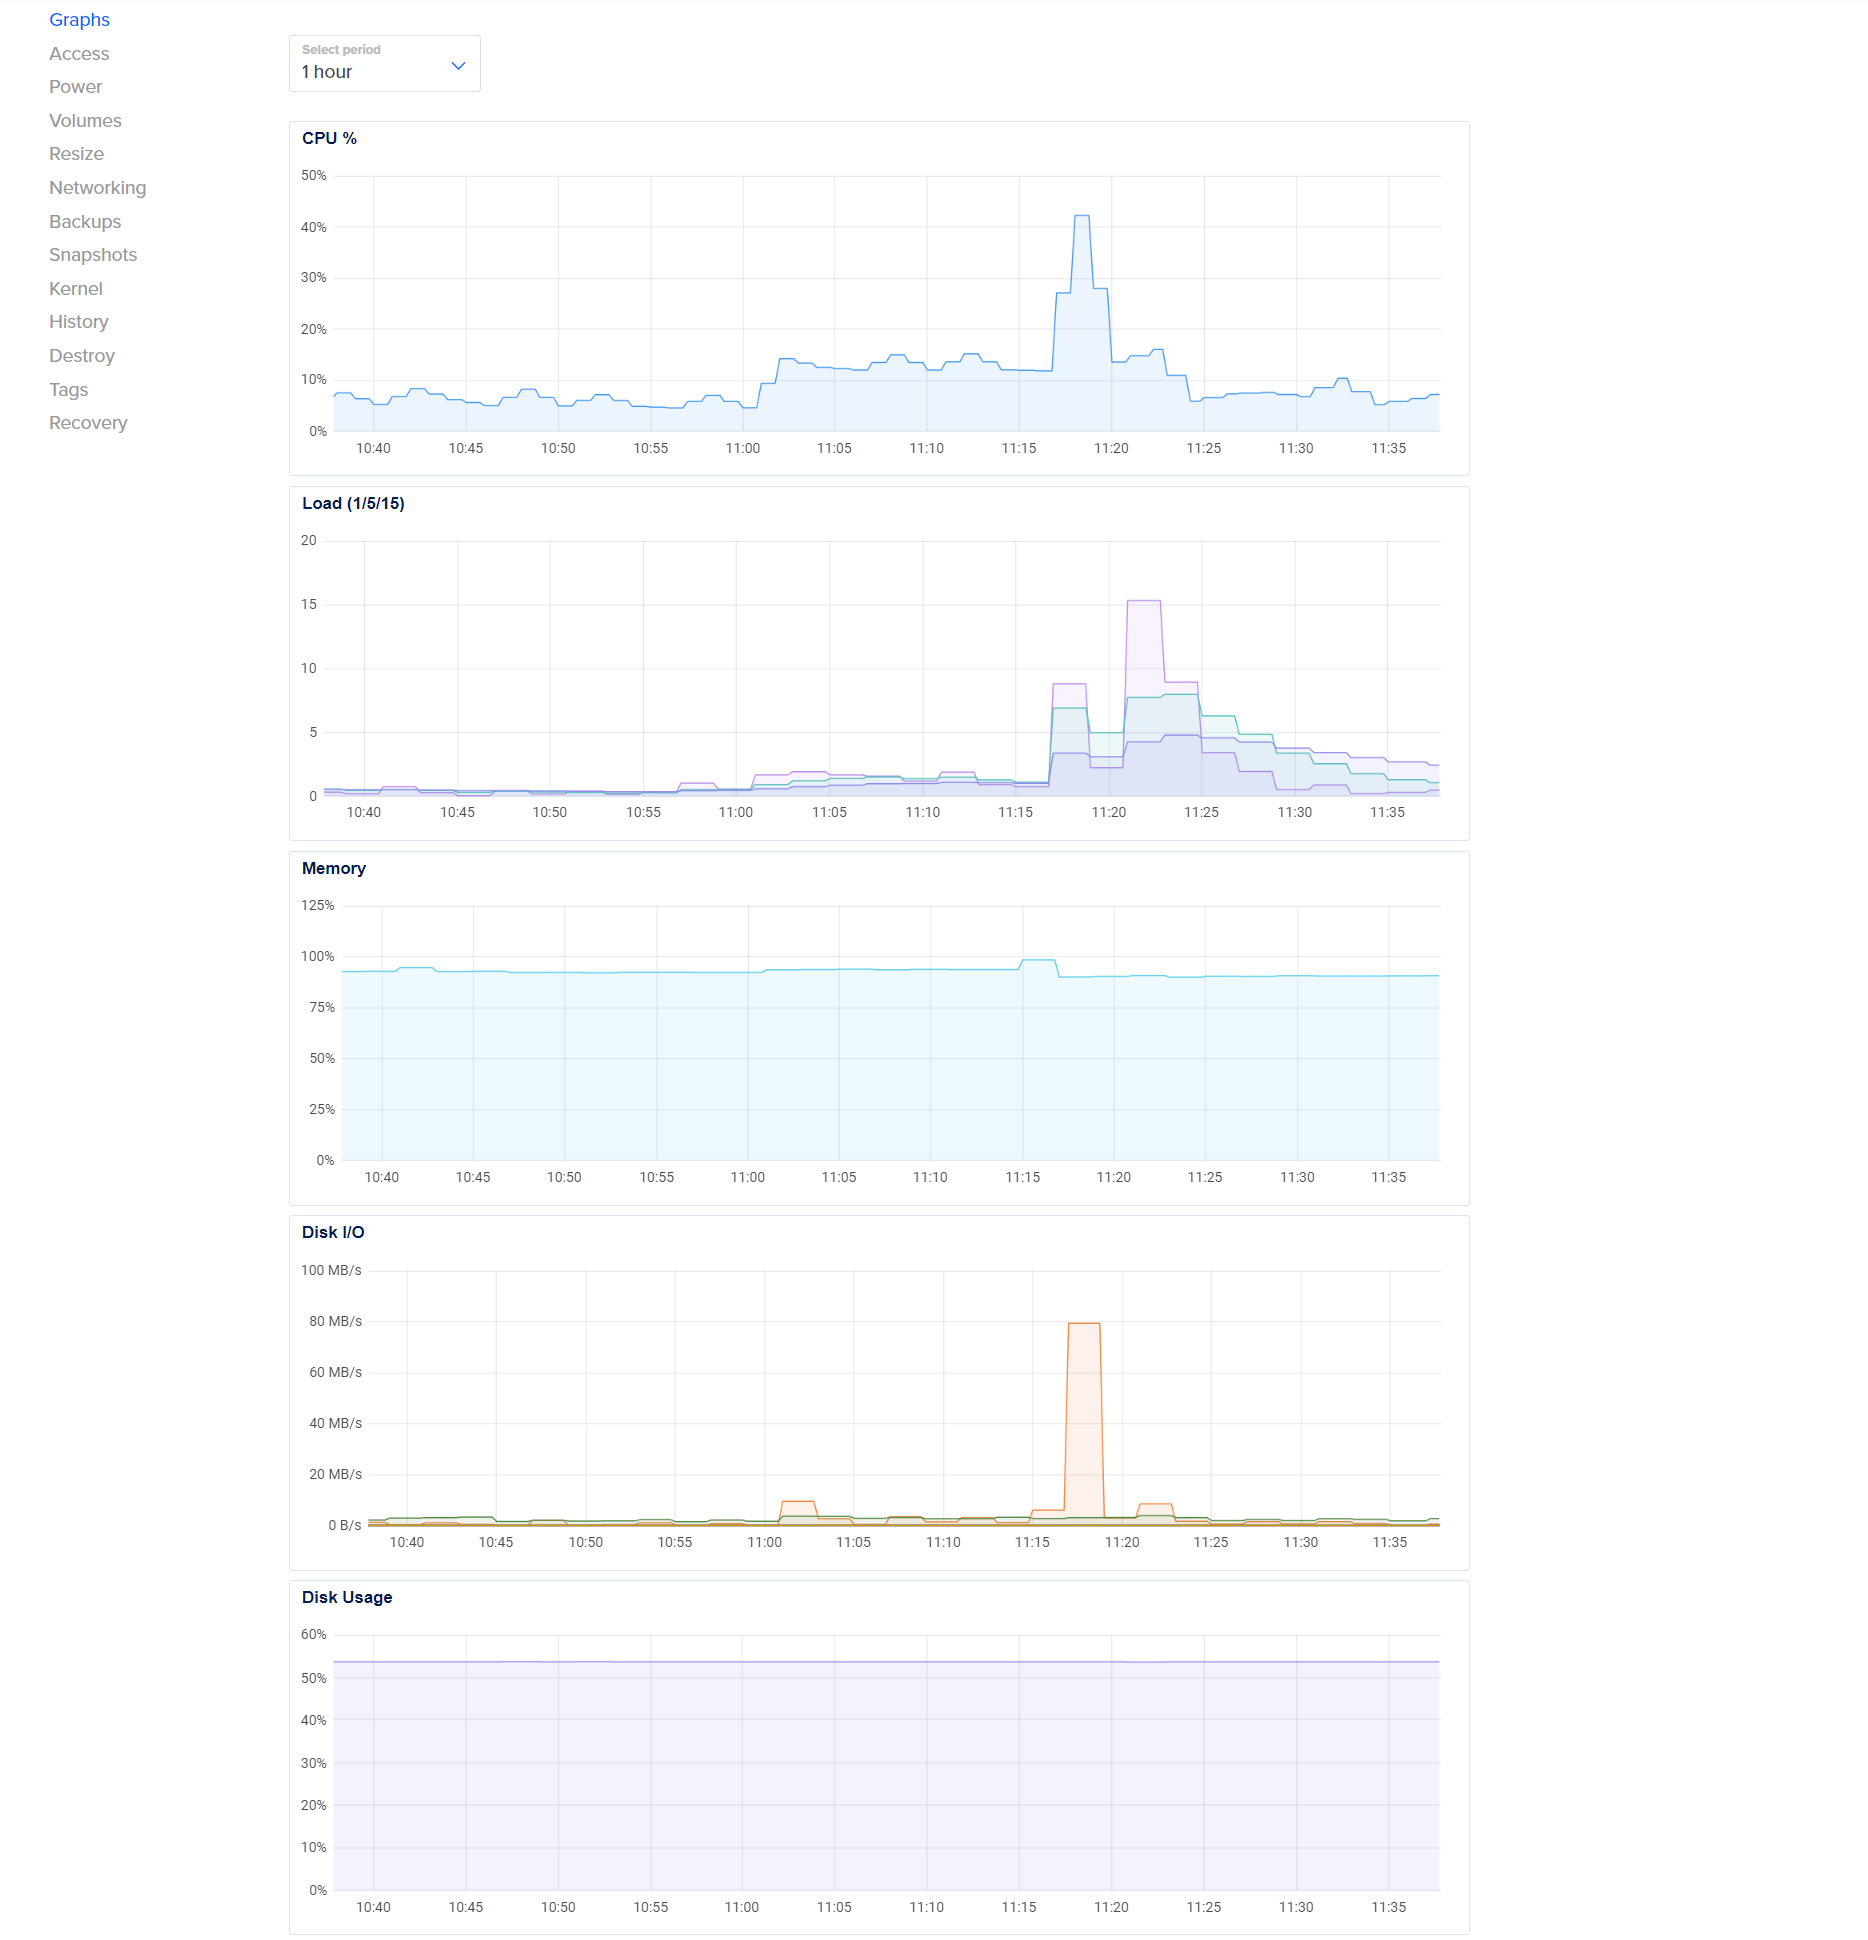
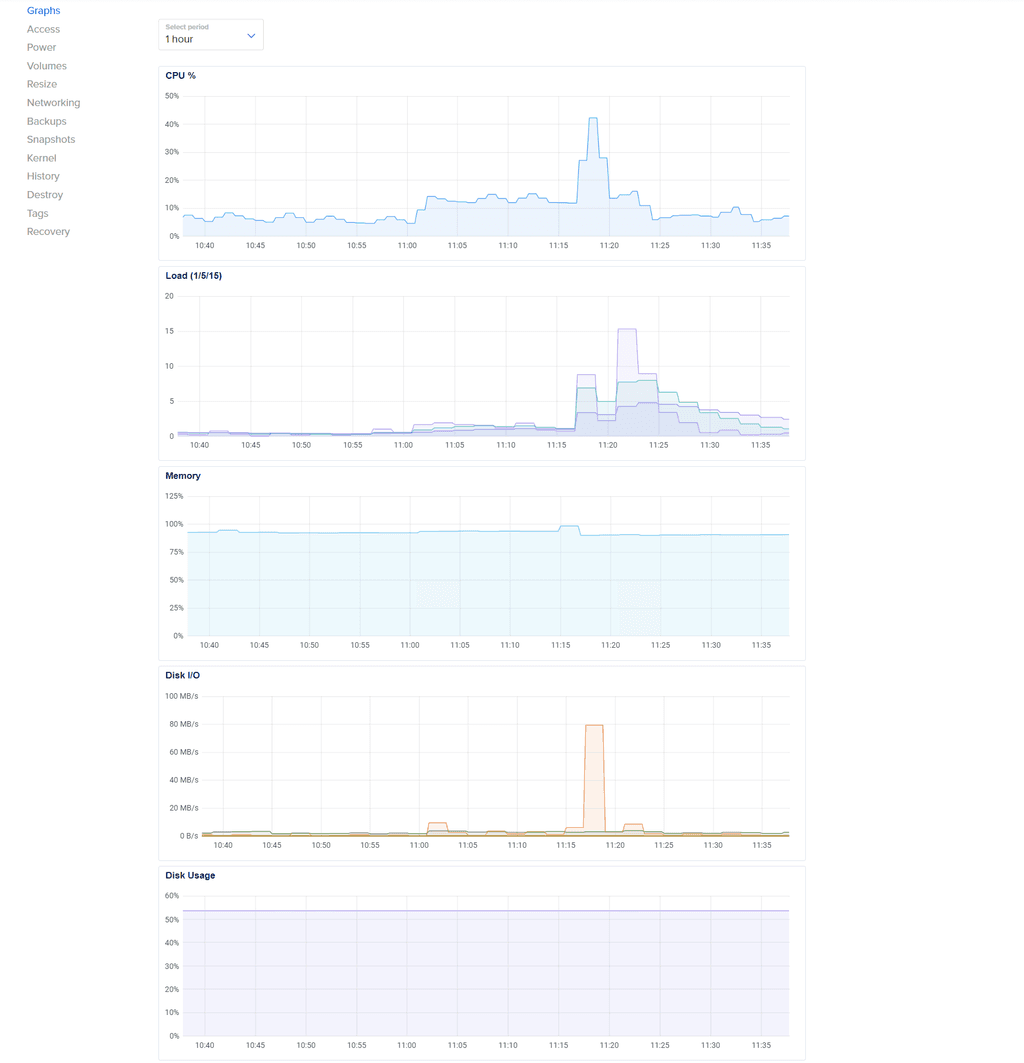
- Droplet 15-minute load Average, keeps shooting up, every day
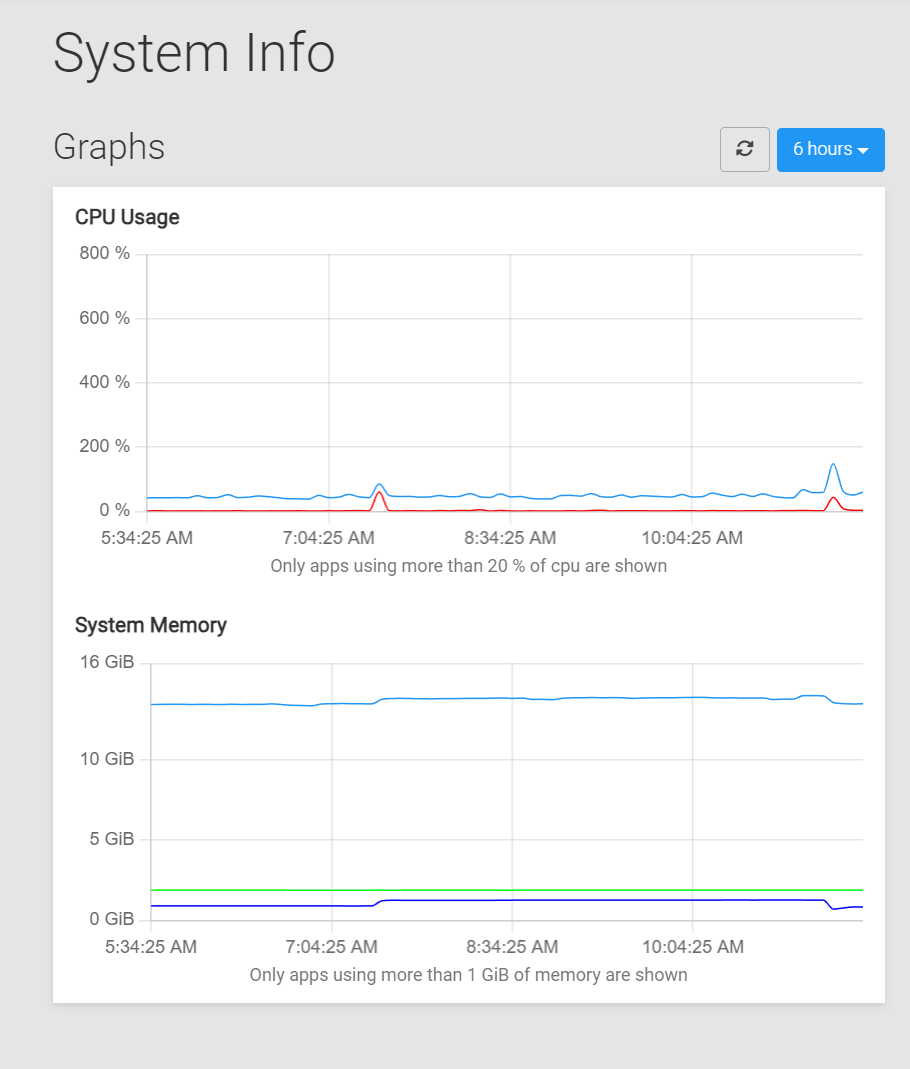
- All this, while the Cloudron graphs don't seem to reflect these anomalies (as seen above)
Droplet graphs shown below:
-
The Cloudron graphs are not showing short-time hikes as such, they are an average over time. Looking at the DO graphs, it seems that your system overall simply runs out of memory on a spiked memory requirement (in this case metabase). The actual memory limit set in Cloudron is only the upper limit, but if you overcommit the physical memory availalbe to the system, then this limit is not very useful.
@nebulon Thanks for the detailed response.
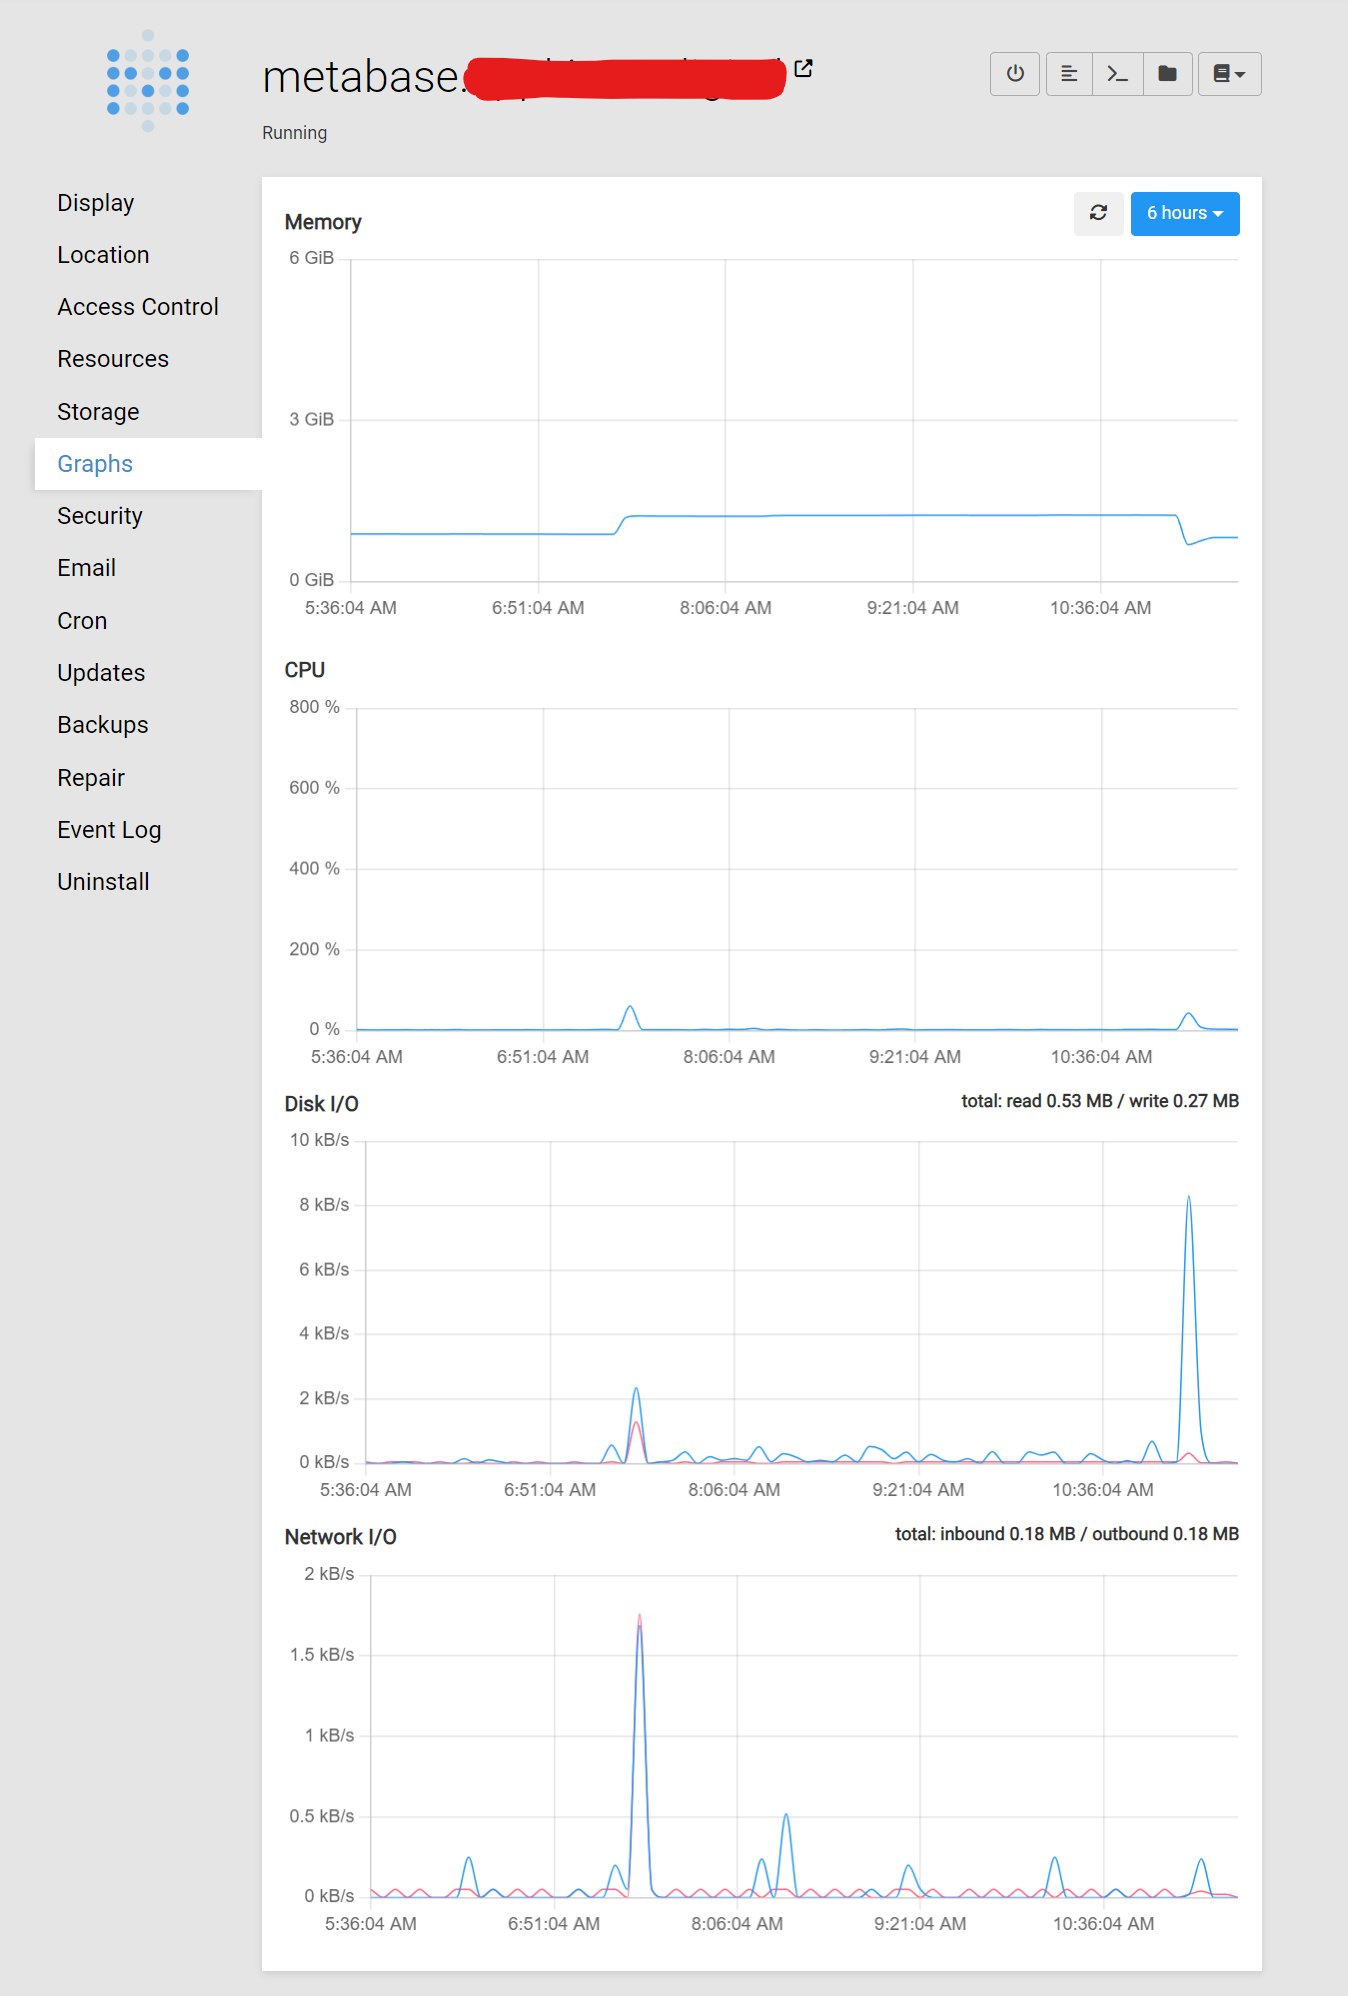
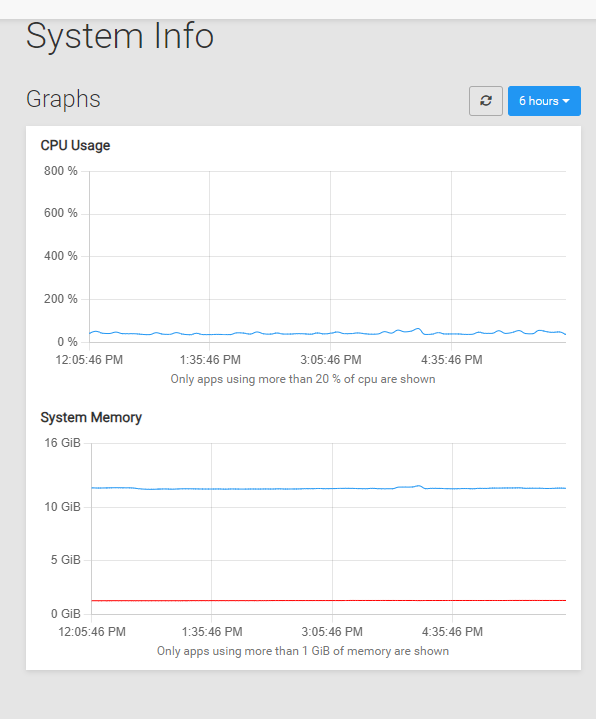
Based on the "System info" graphs:
- The System memory never reaches 16 GB, but the DO resources are maxing out. Is the difference being consumed by the Cloudron 'OS', and if yes, then it should be reflected in the System info graphs, right?
- It's not possible to tell what makes up the memory usage, as only 2 apps (which consume more than 1 GB each) are shown. How do find out who's using all the memory, without having to open up each of the apps individually?
-
@nebulon Thanks for the detailed response.
Based on the "System info" graphs:
- The System memory never reaches 16 GB, but the DO resources are maxing out. Is the difference being consumed by the Cloudron 'OS', and if yes, then it should be reflected in the System info graphs, right?
- It's not possible to tell what makes up the memory usage, as only 2 apps (which consume more than 1 GB each) are shown. How do find out who's using all the memory, without having to open up each of the apps individually?
-
@shrey maybe something like grafana and prometheus will be better for detailed monitoring ?
-
@timconsidine Is there an existing Cloudron API that could be used to fetch and feed the required data to, eg. Grafana?
-
The graphs I got are from my Zabbix monitoring. So I can't be of help directly.
-
Have had similar pain points as OP
What happened to the previous analytics? It used to display individual resources for apps in the graph - was way better than now.
+1 for a dedicated API designed for monitoring apps in Cloudron
-
Hi @nebulon, kindly provide some or the other workaround for this issue, for the time-being.
-
@shrey have you looked at "traditional" linux tools like
top?
I'm not sure it's Cloudron's realm to provide detailed app monitoring- Never came across "top" before, will check it out.
@timconsidine said in Cloudron performance issues:
I'm not sure it's Cloudron's realm to provide detailed app monitoring
A bit surprised at this.
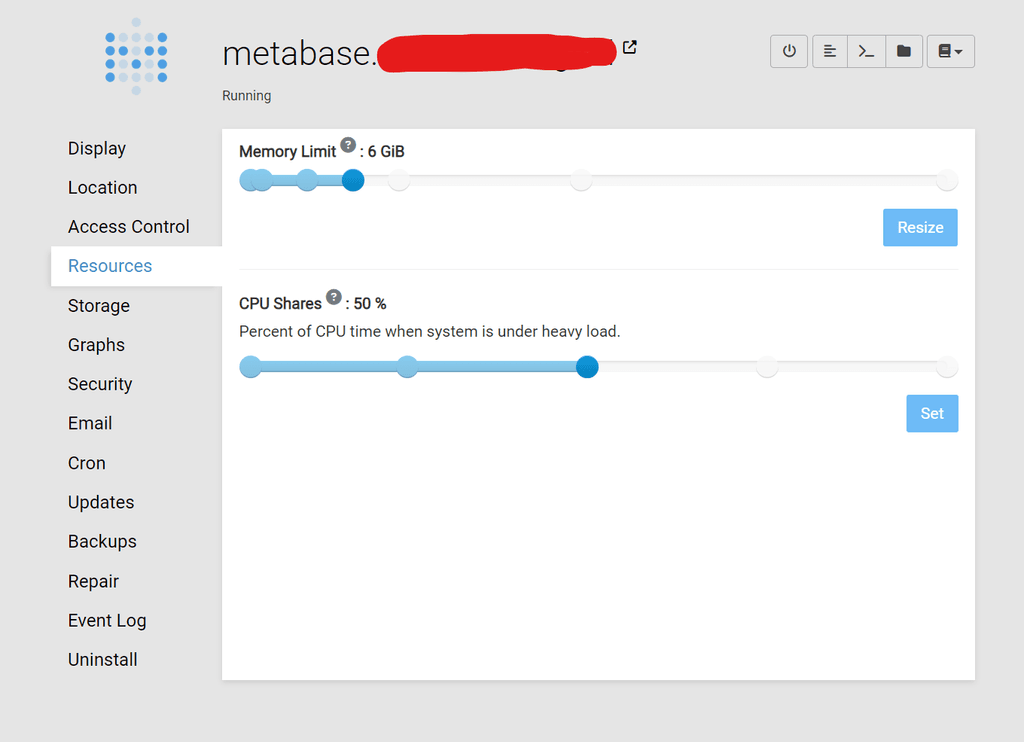
Cloudron currently does provide this:
So, why would the possibility of providing monitoring for all the apps, and not just the heavy-consumer ones be 'out of Cloudron's realm' ?
And enough mechanism (to create the above graphs) already seems to be present, so i'm a bit astounded to be told that even a workaround's not really feasible.
-
The reason we only show the apps with high resource usage is, since usually most apps would then just show a line on the bottom of the graph without real usefulness. The blue line is the cumulative whole system resource usage, so all things together.
We usually aim for some tradeoff between exposing technical detail and usability. As mentioned you have to fallback to native linux tooling for more profiling, but all in all I am not sure you look for the right things in the first place. To come back to the original issue, mattermost ran out of memory, this can either be due to the set memory-limit (which is most likely not the case since yours is at 6Gb) or the system itsel ran out of memory, which seems more likely looking at the usage. Note also that linux kills (and Cloudron will restart) processes as soon as memory runs out, so this very point in time may or may not be visible in a graph, but also its of little value in my opinion.
Further note that not just apps use up memory but also database services (see the services view) and system components itself.
@nebulon said in Cloudron performance issues:
most apps would then just show a line on the bottom of the graph without real usefulness.
not in the case of a stacked line graph.
@nebulon said in Cloudron performance issues:
Further note that not just apps use up memory but also database services (see the services view) and system components itself.
So, the question remains: what's a reliable way of knowing, on a continuous basis, which of the apps/services/system components is consuming.
If it's indeed 'native linux tooling, is there any recommended/existing way of implementing it, that could be shared here?
Because, currently, the situation is somewhat of an opaque black box.
@nebulon said in Cloudron performance issues:
see the services view
Btw, this just gives a real-time estimate (that too, only visual) of the memory usage.
-
We had experimented with a stacked line graph, but similar to showing lines at the bottom it was very noisy, and the question remains, what is the actual use-case here. If no other app is consuming a lot of memory then it is the cumulative memory usage keeping your system occupied.
For point-in-time consumption, assuming that processes do not jump drastically all the time,
toporhtopare good tools to hunt down things.Also note that apps have their own graphs in the app configure view.
I do understand the urge to see detailed resource consumption, but that is a bit of a product on its own and not at the center of Cloudron's vision. Tools like zabbix are the way to go then, but they require more knowledge about how to set up and often make more sense as a monitoring product on separate servers together with uptime monitoring.
Do you generally have an issue that apps kept getting restarted out of memory or did this thread diverge to feature requests for Cloudrons sysadmin monitoring capabilities?
@nebulon Thanks for all the details.
For point-in-time consumption, assuming that processes do not jump drastically all the time, top or htop are good tools to hunt down things.
Will check them out.
Do you generally have an issue that apps kept getting restarted out of memory or did this thread diverge to feature requests for Cloudrons sysadmin monitoring capabilities?
Not generally, but when i do, it would be really helpful to know which of my 50+ apps probably caused it. Based on my current resource allocation structure, even a spike of e.g. 250MB to 900MB could be responsible for a crash, and yet, not be visible in the Graphs (in the current scenario).
So, to answer your question, no, i don't usually run into this sort of issue, but based on this particular incident (which happened multiple times in the past few days), i realised that a better visibility into Cloudron's existing monitoring systems is highly desirable.
-
@nebulon Thanks for all the details.
For point-in-time consumption, assuming that processes do not jump drastically all the time, top or htop are good tools to hunt down things.
Will check them out.
Do you generally have an issue that apps kept getting restarted out of memory or did this thread diverge to feature requests for Cloudrons sysadmin monitoring capabilities?
Not generally, but when i do, it would be really helpful to know which of my 50+ apps probably caused it. Based on my current resource allocation structure, even a spike of e.g. 250MB to 900MB could be responsible for a crash, and yet, not be visible in the Graphs (in the current scenario).
So, to answer your question, no, i don't usually run into this sort of issue, but based on this particular incident (which happened multiple times in the past few days), i realised that a better visibility into Cloudron's existing monitoring systems is highly desirable.
@shrey said in Cloudron performance issues:
even a spike of e.g. 250MB to 900MB could be responsible for a crash
In my experience, even the best monitoring in all the world is not going to resolve that situation.
It is indicative of a server working close to its limits.
If all is going well for you, then that's good.
If that were my situation, I would be considering a server upgrade.
I appreciate that could be costly on DO, but last time I looked, Hetzner have good offerings (especially in their Auction section). -
@shrey said in Cloudron performance issues:
even a spike of e.g. 250MB to 900MB could be responsible for a crash
In my experience, even the best monitoring in all the world is not going to resolve that situation.
It is indicative of a server working close to its limits.
If all is going well for you, then that's good.
If that were my situation, I would be considering a server upgrade.
I appreciate that could be costly on DO, but last time I looked, Hetzner have good offerings (especially in their Auction section).@timconsidine said in Cloudron performance issues:
If that were my situation, I would be considering a server upgrade.
I appreciate that could be costly on DO, but last time I looked, Hetzner have good offerings (especially in their Auction section).Thanks.
Indeed, DO gets costly very quickly, but i believe Hetzner doesn't have any datacenters in my region, unfortunately. -
Understood. I am in UK but use Hetzner in DE, and don't have any performance issues.
-
 G girish marked this topic as a question on
-
G girish has marked this topic as solved on
Hello! It looks like you're interested in this conversation, but you don't have an account yet.
Getting fed up of having to scroll through the same posts each visit? When you register for an account, you'll always come back to exactly where you were before, and choose to be notified of new replies (either via email, or push notification). You'll also be able to save bookmarks and upvote posts to show your appreciation to other community members.
With your input, this post could be even better 💗
Register Login