Had the same problem. Thanks for the post.
simon
Posts
-
PostGres SQL Error update from v1.112.4 to v1.113.0 -
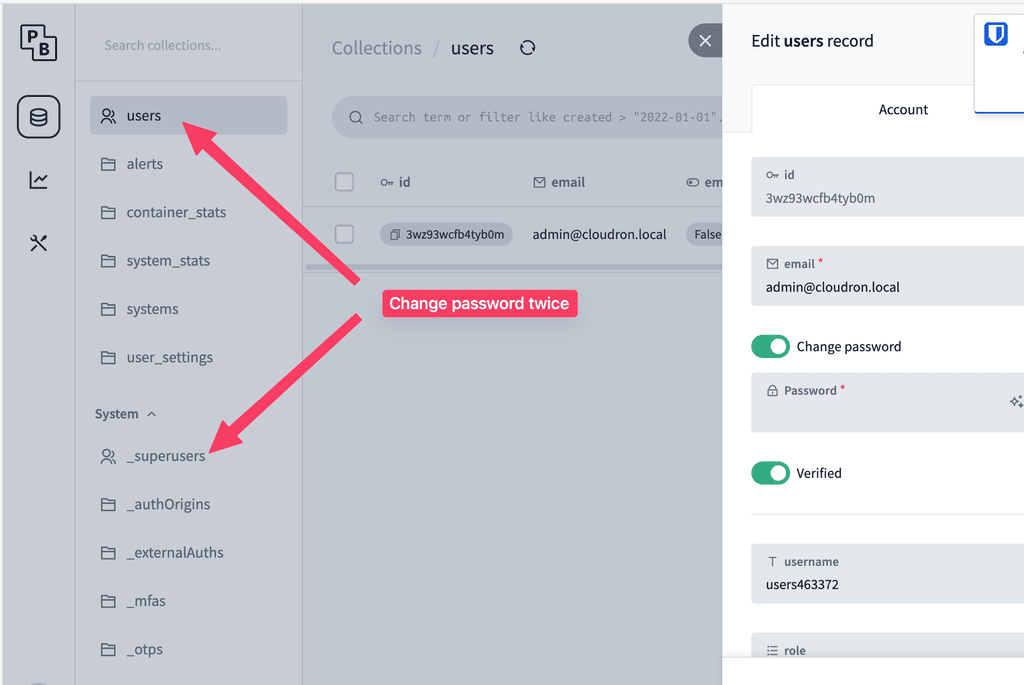
Where can I change the default password?I got it. You have to change the password in two places. In Users and in Superusers. The user with the same email address appears in both tables.

-
Where can I change the default password?Hi Joseph,
Thanks for your feedback. That's exactly what I did.
PocketBase accepts the password change. However, I can still log in to Beszel with “changeme” and NOT with the new password. Even after restarting Baszle. -
Where can I change the default password?Am I being stupid? I can't change the default password “changeme”. The change works in Pocket, and logging in there with the new password is no problem. However, even after restarting, Beszel only accepts the initial password. The Cloudron documentation is still empty, and the “First Time Usage” info after installation says that I should change the password, but not where.
-
checkmk monitoring solutionEven though the suggestion is a bit older and hasn't found any supporters yet, Cloudron still lacks server monitoring software!
My primary concern would be to monitor other servers such as web or database servers. And in more depth than just uptime. As a nice side effect, the Cloudron server could perhaps also be monitored.
A good list of features can be found at https://checkmk.com/product/server-monitoring-software:Scalable server monitoring software for Sysadmins and DevOps
Ensure peak server performance for your infrastructure with the best server monitoring. Say goodbye to preventable outages, late nights, or weekend emergencies.- Monitor any type of server (web, mail, database servers etc.)
- Flexible server monitoring through the use of more than 2,000 smart checks
- Easy-to-use configuration, auto-discovery and network mapping
- Native agents for Windows, Linux and many more operating systems
- Agentless monitoring with SNMP and TCP/UDP (FTP, LDAP, IMAP etc.)
- API-based checks based on HTTP/XML, SSH or TELNET
- Measurement intervals as short as <1 minute
There is a Docker installation: https://docs.checkmk.com/latest/en/introduction_docker.html
In addition is the Checkmk Raw Edition free and 100% open-source.See also https://github.com/Checkmk/checkmk
-
Since v8.2.3: "Backup failed: Too many executable files."Hm, ok.
It seems that there are numerous executable files in my installation. In the plugins, plugin-assets, themes, files.
I have now changed everything and the backup will now work again. Thanks for your support.Basically, this is a useful thing. However, I don't like the fact that the check has caused the backups of all other apps to be canceled as well. As an idea: wouldn't it perhaps make sense to check this independently of the backups?
-
Since v8.2.3: "Backup failed: Too many executable files."It's Redmine. And if I look at it quickly, the plug-in files are affected. A lot different files: png, yml, rb, erb, js, css ...
-
Since v8.2.3: "Backup failed: Too many executable files."Since the update to v8.2.3 (08.01.25), my backups have stopped running.
Error message
“Backup failed: Too many executable files. Run ‘find /home/yellowtent/appsdata/ed9dfcbb-195e-45a1-91db-93ce9cbd42bd -type f -executable’ to investigate. Logs are available”.I actually find 71728 lines.
However, I don't know what to do now. Can someone give me a tip?
The problem is similiar to https://forum.cloudron.io/topic/13047/since-update-to-v8-2-1-backups-fail-with-too-many-empty-directories/16, but theire is also no solution.
I create backups via sshfs (hetzner storagebox) and rsync. -
AFFiNE - open-source Notion, Miro, Monday, Outline, Appflowy alternativeGreat app, would be perfect for Cloudron.
-
Uptime Kuma Web-UI broken (empty)@joseph good idea. Thanks for the support.
-
Uptime Kuma Web-UI broken (empty)Thank you for the feedback.
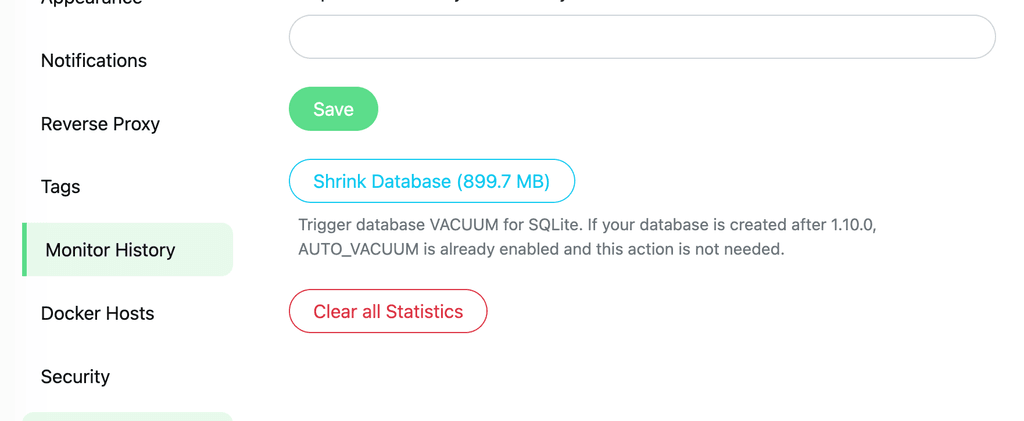
Kuma has only been running for 3 months. The database is about 800 MB in size and cannot be reduced in size via the settings. I have now reduced the data retention to 100 days. Since I have seen the problem several times in the last few weeks, I don't expect this to solve the problem.
-
Uptime Kuma Web-UI broken (empty)I have about 50 monitors running. Monitoring is reliable, notifications are coming in.
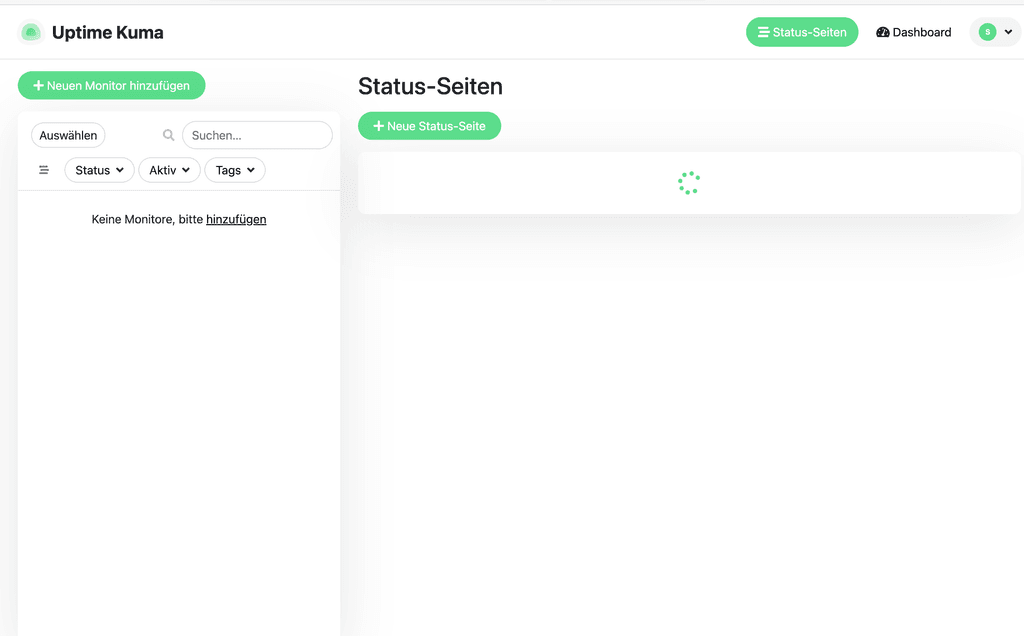
However, the web UI regularly crashes after a little longer uptime (haha!). Then the entries/monitors are not updated, or are missing, or the whole app is not loaded.
Browser Reload does not help, Server Restart does.
The log is unremarkable. I couldn't find any comparable reports in the forum yet. Am I the only one with this problem?

-
App "Not responding" with Error 502Thank you very much.
Absolutely right, that helped me.
ONLYOFFICE Docs 8.1.3 Package Version com.onlyoffice.coudronapp@1.17.2 restore from backup works. But updates then fail.
So I installed the latest version directly from the app store, changed the secret and made the corresponding changes in Nextcloud (/settings/admin/onlyoffice). So just a whole restart. You really don't lose anything.
Now it's running again. Thanks. -
App "Not responding" with Error 502I have had an unclear problem for two days: OnlyOffice App throws error 502, not responding.
Restarting, recovery mode etc. has not helped. Logs are not revealing (to me).
Currently there is an update to package 1.18.2, but this may not be installed due to the error and cannot be triggered manually.
Does anyone have any ideas?Nov 13 08:53:36 - [2024-11-13T07:53:36.378] [ERROR] [localhost] [docId] [userId] nodeJS - DB table "task_result" does not contain columns: created_at,password,additional, columns info: change_id,status,status_info,last_open_date,user_index,tenant,callback,baseurl,id Nov 13 08:53:40 - 2024/11/13 07:53:40 [error] 124#124: *1 connect() failed (111: Unknown error) while connecting to upstream, client: 172.18.0.1, server: , request: "GET /healthcheck HTTP/1.1", upstream: "http://[::1]:8000/healthcheck", host: "onlyoffice.example.com" Nov 13 08:53:40 - 2024/11/13 07:53:40 [error] 124#124: *1 connect() failed (111: Unknown error) while connecting to upstream, client: 172.18.0.1, server: , request: "GET /healthcheck HTTP/1.1", upstream: "http://127.0.0.1:8000/healthcheck", host: "onlyoffice.example.com" Nov 13 08:53:40 - 172.18.0.1 - - [13/Nov/2024:07:53:40 +0000] "GET /healthcheck HTTP/1.1" 502 150 "-" "Mozilla (CloudronHealth)" Nov 13 08:53:40 => Healtheck error got response status 502 -
Online/offline status indicator in the Mac App brokenThanks for the tip, I have entered it there: https://forum.mattermost.com/t/online-offline-status-indicator-in-the-mac-app-broken/19481/3
-
Online/offline status indicator in the Mac App brokenMy problem is probably a bit off-topic as it only relates to the desktop app (Mac). However, nobody else seems to have the problem and it has only occurred very recently and without updating the app. So I'll try my luck here!

In the desktop app, the user's online status (green tick next to the profile picture) has only been displayed as ‘offline’ for a few days now.
If the user is logged into the browser, the status is displayed correctly both in the browser and in the app. However, if the user is only logged into the app, the status is marked as offline. Manual changes to the status are only retained until the next reload/restart of the app.Reinstalling, updating the app, clearing the cache and restarting the server have been tried. Without success.
I can't find anything in the server logs, in the app logs or in the app's Dev Console. No comparable case can be found on Google, on Github (desktop app), there is only an older issue for the Windows app.Is it the same for others? Does anyone have an idea?
Desktop App version 5.9.0 (but also 5.2.2), server version 9.10.1., Cloudron Package Version 2.2.0
-
Best alternative to Wordpress for static sites?I am a big fan of Statamic CMS.
A bit similar to Grav, but better in my opinion. Based on Laravel (i.e. PHP), can be used with or without a database (flatfile first), headless/JAMstack or classic, suitable for small or very large sites, great maintenance backend for editors, well documented, easy to update ... -
netdata - real-time monitoringand to mention it again: a Netdata installation could run in the OS of the Cloudron host system like on any other server, which sends metrics to a Netdata Cloudron app via a configured stream.conf. In this case, everything would remain isolated. But of course you would have to test it!
-
netdata - real-time monitoring@girish said in netdata - real-time monitoring:
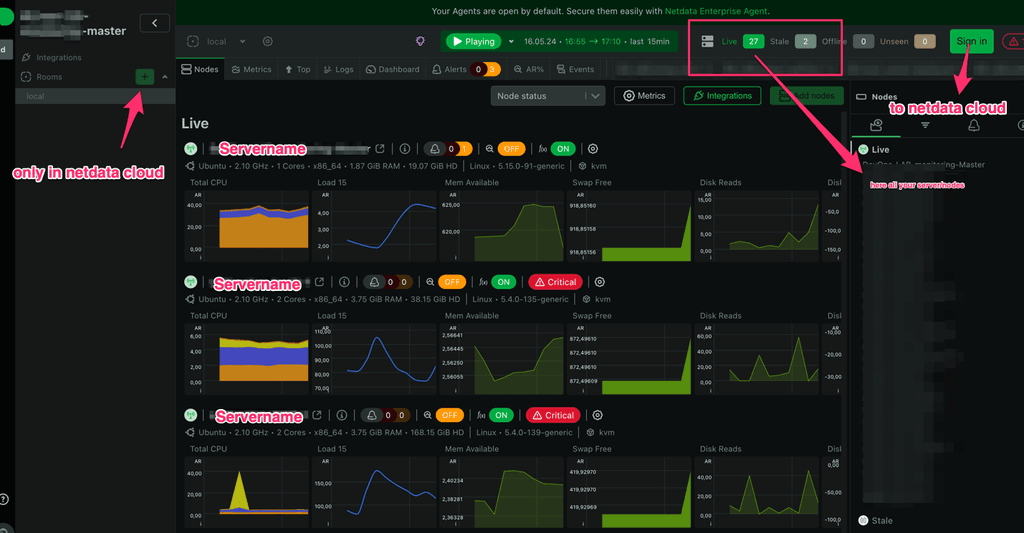
The add node button was disabled and it asks me to go to the cloud.
This is also part of the dark pattern. If you are logged into the cloud, you will find instructions on how to add nodes behind this button.
As far as I understand it correctly (I wouldn't call myself a professional either!), Netdata basically works as follows:
There is ONE application that can:- monitor its own host system and output the result on a web interface. This is the case that you obviously have on your computer now.
- alternatively, every Netdata application can also send data (additionally or exclusively) to other nodes. This is where Netdata's advertising comes in. If you want more than an unsecured output via port 19999 on the system to be monitored, you should preferably go to the cloud and pay! But it also works without a paid cloud, just not as convincingly.
- or the Netdata installation acts as the master (or parent node) processes the data from other nodes (child nodes). In other words, it can display, act, send alarms, etc. That would be the variant that I could very well imagine as a Cloudron app. In this case, however, the child nodes are not added via the UI of the master, but via an entry in stream.conf on the sending Netdata. As soon as the master receives data, the UI changes slightly and you can switch between different nodes.
This is explained quite clearly at https://www.netdata.cloud/blog/netdata-parents-streaming-replication/.
It is also important to know that Netdata should always run behind a proxy: https://learn.netdata.cloud/docs/netdata-agent/configuration/running-the-netdata-agent-behind-a-reverse-proxy/

-
netdata - real-time monitoringI understand what you mean, basically these are exactly the points I suspected at the beginning.
However, I probably expressed myself incorrectly in option 2. You can also operate a master with the current UI that displays all nodes together or individually. That's quite a lot! You get very detailed and precise information about what is currently running (or not) on a server. The alarms are also very helpful. You can manage them centrally with a central node. Hard disks or SWAP that are full, RAM problems and even DDos can be recognised.
However, you have to live with the fact that the login button goes to the cloud and functions such as the war rooms only work there. This is somewhat confusing and could be unsatisfactory for Cloudron users.So my conclusion: this can make sense on Cloudron. It is a popular tool and, in my opinion, one of the best in the area of server monitoring. I would use the app.
Option 1:
you could of course also treat the Cloudron server as a child node. Then the app has no direct access to the host system. Simply install the agent normally on the shell and have the metrics delivered to a possible app (option 2). This would just be option 2 + two lines in the documentation.
