
Per Application CPU Usage in Server Graphs
-
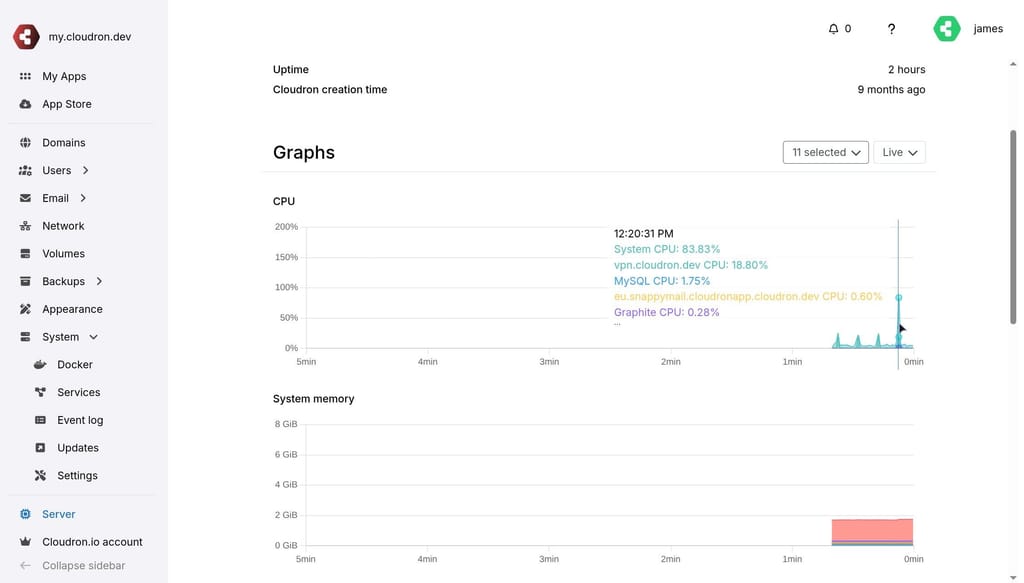
Currently, Cloudron displays the totality of CPU usage of applications but not which ones are using most CPU.
It would be helpful to have some colour indicators to gain a clearer idea of which ones are the main CPU cycle hogs and which ones might be responsible for recurring spikes in usage.
-
That would work well. I didn't know about this.
I had in mind something like this:
https://echarts.apache.org/examples/en/editor.html?c=area-stackAnd now i see it, i can select applications and create a chart just like i wanted.
The problem is that it is showing high usage for system CPU, not for applications in particular. It is quite an old cpu so maybe that is why.



Hello! It looks like you're interested in this conversation, but you don't have an account yet.
Getting fed up of having to scroll through the same posts each visit? When you register for an account, you'll always come back to exactly where you were before, and choose to be notified of new replies (either via email, or push notification). You'll also be able to save bookmarks and upvote posts to show your appreciation to other community members.
With your input, this post could be even better 💗
Register Login