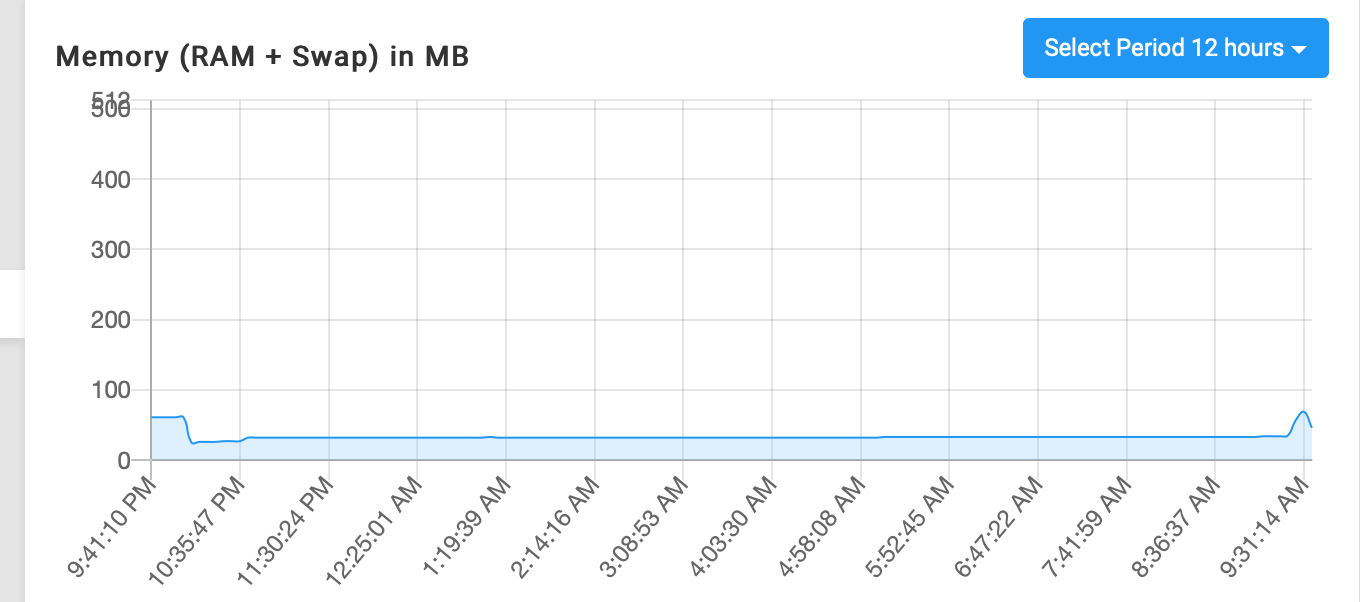
App restarted due to memory limit reached, but graph shows nothing lose to memory limit
-
I just had an app get restarted due to memory limit being reached, which is as designed, but in this case I went to actually check the resource graphs tab on the app because it's an app that's normally very low in memory usage, and I see nothing close to the max.
The max is set to 512 MB (so if half is RAM and half is swap that's 256 MB each), but it doesn't even seem to reach the usage of 100 MB.
The app just restarted about 10 minutes ago, this is the graph it shows right now.
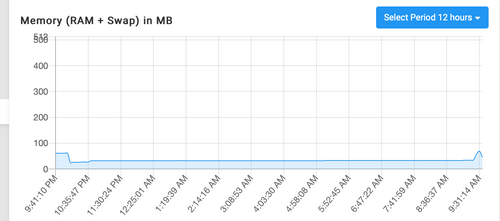
Any ideas why that'd be? I worry that either A) the graphs are not correct or B) the app was restarted prematurely due to a monitoring bug perhaps.
In case it matters what app, it was Radicale. And as you can see it uses very low amounts of memory normally, not even 50 MB on average.
-
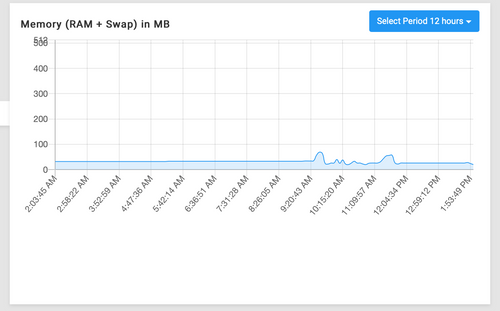
Update: For some reason this app has now restarted about 4 times today so there's something going on but I don't know what (I see no errors in the logs of the app and I'm the only one who uses this one and am not doing anything on it today, haven't really touched it in months now since I had to fix that Bad Gateway error from a while back).
At no point does the memory graph show it's running low on memory, or even comes close to it. Here is the updated graph.
-
Here is the output from the Event Log showing that it restarted due to being out of memory:
{ "event": { "status": "oom", "id": "8329438f5147105376f018788cd0a4d3e8966bf32a1ab20a9d499911d7fae390", "from": "cloudron/org.radicale.cloudronapp2:20200915-101717-81751ec92", "Type": "container", "Action": "oom", "Actor": { "ID": "8329438f5147105376f018788cd0a4d3e8966bf32a1ab20a9d499911d7fae390", "Attributes": { "appId": "d3121e48-4196-48fe-907d-ee831e11ce5c", "fqdn": "<hostname>.<domain.tld>", "image": "cloudron/org.radicale.cloudronapp2:20200915-101717-81751ec92", "isCloudronManaged": "true", "isSubcontainer": "false", "name": "d3121e48-4196-48fe-907d-ee831e11ce5c" } }, "scope": "local", "time": 1605477388, "timeNano": 1605477388013909500 }, "containerId": "8329438f5147105376f018788cd0a4d3e8966bf32a1ab20a9d499911d7fae390", "addon": null, "app": { "id": "d3121e48-4196-48fe-907d-ee831e11ce5c", "appStoreId": "org.radicale.cloudronapp2", "installationState": "installed", "runState": "running", "health": "healthy", "containerId": "8329438f5147105376f018788cd0a4d3e8966bf32a1ab20a9d499911d7fae390", "httpPort": 45367, "location": "<hostname>", "domain": "<domain.tld>", "memoryLimit": 536870912, "cpuShares": 512, "label": null, "taskId": null, "sso": true, "enableBackup": true, "creationTime": "2020-09-17T17:58:31.000Z", "updateTime": "2020-09-17T17:58:31.000Z", "mailboxName": null, "mailboxDomain": null, "enableAutomaticUpdate": true, "dataDir": null, "ts": "2020-11-15T21:56:20.000Z", "healthTime": "2020-11-15T21:56:20.000Z", "alternateDomains": [], "manifest": { "id": "org.radicale.cloudronapp2", "title": "Radicale", "author": "Radicale Developers", "description": "This app packages Radicale version <upstream>3.0.6</upstream>\n\n### The Radicale Project is a CalDAV (calendar) and CardDAV (contact) server solution.\n\nCalendars and address books can be viewed, edited and synced by calendar and contact clients on mobile phones or computers.\n\nOfficially supported clients are listed [here](https://radicale.org/2.1.html#documentation/clients), other DAV compatible clients may work as well.\n\n", "tagline": "A Calendar and Contact Server", "version": "2.0.5-1", "healthCheckPath": "/", "httpPort": 5232, "manifestVersion": 2, "website": "http://radicale.org/", "contactEmail": "support@cloudron.io", "changelog": "* Update to Radicale 3.0.6\n* Allow web plugins to handle POST requests\n", "icon": "logo.png", "tags": [ "caldav", "carddav", "contacts", "calendar", "sync" ], "addons": { "localstorage": {}, "ldap": {} }, "mediaLinks": [ "https://screenshots.cloudron.io/org.radicale.cloudronapp/1.png", "https://screenshots.cloudron.io/org.radicale.cloudronapp/2.png" ], "minBoxVersion": "5.3.0", "documentationUrl": "https://cloudron.io/documentation/apps/radicale/", "forumUrl": "https://forum.cloudron.io/category/76/radicale", "dockerImage": "cloudron/org.radicale.cloudronapp2:20200915-101717-81751ec92" }, "tags": [], "reverseProxyConfig": { "robotsTxt": "# Disable search engine indexing\n\nUser-agent: *\nDisallow: /", "csp": null }, "portBindings": {}, "accessRestriction": null, "debugMode": null, "servicesConfig": {}, "binds": {}, "env": {}, "error": null, "iconUrl": "/api/v1/apps/d3121e48-4196-48fe-907d-ee831e11ce5c/icon", "fqdn": "<hostname>.<domain.tld>" } } -
How is the server overall doing memory wise? Maybe the system itself does not have enough memory left to even hit the set limits?
Also are you aware of maybe some large sync task into radicale, which may spike its memory usage very short term, so it does not even get registered with the memory graph?
-
Right.. as @nebulon said, the graphs are not real time. It's just collected every 10 minutes or so and rest of the points in the graph are just interpolated.
Also, there is no telling which process the kernel chooses to kill to free up memory. I think there are some variables you can adjust per process (but Cloudron does not set those other than box code itself). https://ngelinux.com/configure-oom-killer-in-linux/ has some high level overview about the system variables.
-
How is the server overall doing memory wise? Maybe the system itself does not have enough memory left to even hit the set limits?
Also are you aware of maybe some large sync task into radicale, which may spike its memory usage very short term, so it does not even get registered with the memory graph?
@nebulon & @girish - Thank you for the questions.
-
I'm unaware of any large sync task going on, no. The logs don't indicate anything, and I'm the only one using the app and I haven't been making any large changes (i.e. I haven't removed an account and recreated it on my computer thus triggering a full resync for example).
-
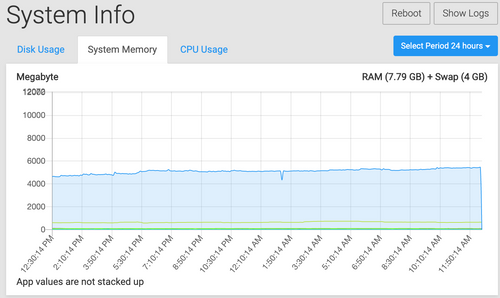
System memory seems to be more than capable right now, and has been for a long time. Here's the 24 hour review from Cloudron:
So I guess what you're saying is since the graphs only collect every 10 minutes as snapshots in time, then if something suddenly raises the memory usage within a couple of minutes until it crashes, that won't be recorded at all on the graphs, right? That's unfortunate if true. Is there a way perhaps to improve it so the graphs are forcefully collected just before a container is killed (i.e. be part of the Docker kill process perhaps) so we can see what the memory usage actually was?
What I did yesterday after seeing the issue happening so frequently was restore from an earlier morning backup before the reboots started happening for outOfMemory errors, and it was killed once more after that but not since then. Yesterday it was happening almost every 45-90 minutes, and the last time it was restarted now according to my event log is 14 hours ago, which is strange but seems like it's maybe settled now whatever it was that was going on.
-
-
@nebulon & @girish - Thank you for the questions.
-
I'm unaware of any large sync task going on, no. The logs don't indicate anything, and I'm the only one using the app and I haven't been making any large changes (i.e. I haven't removed an account and recreated it on my computer thus triggering a full resync for example).
-
System memory seems to be more than capable right now, and has been for a long time. Here's the 24 hour review from Cloudron:

So I guess what you're saying is since the graphs only collect every 10 minutes as snapshots in time, then if something suddenly raises the memory usage within a couple of minutes until it crashes, that won't be recorded at all on the graphs, right? That's unfortunate if true. Is there a way perhaps to improve it so the graphs are forcefully collected just before a container is killed (i.e. be part of the Docker kill process perhaps) so we can see what the memory usage actually was?
What I did yesterday after seeing the issue happening so frequently was restore from an earlier morning backup before the reboots started happening for outOfMemory errors, and it was killed once more after that but not since then. Yesterday it was happening almost every 45-90 minutes, and the last time it was restarted now according to my event log is 14 hours ago, which is strange but seems like it's maybe settled now whatever it was that was going on.
I've also had OOM for some apps without anything registered in the graphs (I was initially surprised, then concluded the data was incomplete).
If it's random spike of memory, I don't know how to debug. Most of the time, I just up the memory limit of the app.
-
-
One of the reasons I posted this, could be a MySQL config issue not utilising all the parallel processing capabilities if my.cnf is defaults: https://forum.cloudron.io/topic/3625/mysql-tuning-with-my-cnf-settings-optimisation
-
One of the reasons I posted this, could be a MySQL config issue not utilising all the parallel processing capabilities if my.cnf is defaults: https://forum.cloudron.io/topic/3625/mysql-tuning-with-my-cnf-settings-optimisation
@marcusquinn This wouldn’t cause an OOM error though for the app would it? Radicale in this case doesn’t even use MySQL.
-
This may be related to a kernel update from Canonical or some sort of instant resource exhaustion attack sweeping the net.
I've also had many idle WP sites get OOM killed for no apparent reason.
I am not liking the 50% swap per app, as it hides the actual amount of memory assigned and things seem to get killed halfway which overinflates resource settings.
I agree with @d19dotca that App mem logs should increase when upper thresholds are met, maybe even throw a notification before it's killed so you have a time stamp near the beginning of whatever made memory jump.
I can also recommend a log monitoring service that can catch the root cause of things by design. Ping me if interested.
-
@marcusquinn This wouldn’t cause an OOM error though for the app would it? Radicale in this case doesn’t even use MySQL.
@d19dotca certainly a misconfiguration of any DB can allow for memory exhaustion and displacing other services.
-
@d19dotca certainly a misconfiguration of any DB can allow for memory exhaustion and displacing other services.
@marcusquinn since this is a shared DB environment, then multiple Apps would be killed not just some using the same DB.
-
The addons have their own memory limit and would in this case be restarted on their own independent from the apps. The apps have to be able to handle db reconnects. However if you would see addon crashes and app crashes together, then this could indicate some issue with the reconnection logic in the app, however I have not seen those so far.
-
@d19dotca certainly a misconfiguration of any DB can allow for memory exhaustion and displacing other services.
-
The addons have their own memory limit and would in this case be restarted on their own independent from the apps. The apps have to be able to handle db reconnects. However if you would see addon crashes and app crashes together, then this could indicate some issue with the reconnection logic in the app, however I have not seen those so far.
@nebulon Agreed. So what I've done even though I have no idea why it's acting up suddenly the last couple of days, is bumped up the memory limit to 1 GB. It's far more than it needs when the graph clearly shows it hovering around just 50 MB most of the time, but I forgot that just because I set 1 GB as the max memory limit doesn't mean it's reserving 1 GB of memory for it on the system, so once I remembered that I realized it's not a bad thing to increase the memory limit higher than it needs. But please correct me if I've misunderstood that part.
-
@nebulon Agreed. So what I've done even though I have no idea why it's acting up suddenly the last couple of days, is bumped up the memory limit to 1 GB. It's far more than it needs when the graph clearly shows it hovering around just 50 MB most of the time, but I forgot that just because I set 1 GB as the max memory limit doesn't mean it's reserving 1 GB of memory for it on the system, so once I remembered that I realized it's not a bad thing to increase the memory limit higher than it needs. But please correct me if I've misunderstood that part.
@d19dotca Yes, the limits are there to protect against the noisy neighbor problem which exists when many processes are competing for the same resources and ONE uses up more than their fair share.
Technically we could have all 30 Apps be set to 1+GB on a 16GB RAM system and it would work fine until one App behaved badly. Then the system would be in trouble as the OOM killer would select a potentially critical service to kill.
With limits, the system is happy, and the killing happens in containers instead.
Hello! It looks like you're interested in this conversation, but you don't have an account yet.
Getting fed up of having to scroll through the same posts each visit? When you register for an account, you'll always come back to exactly where you were before, and choose to be notified of new replies (either via email, or push notification). You'll also be able to save bookmarks and upvote posts to show your appreciation to other community members.
With your input, this post could be even better 💗
Register Login
