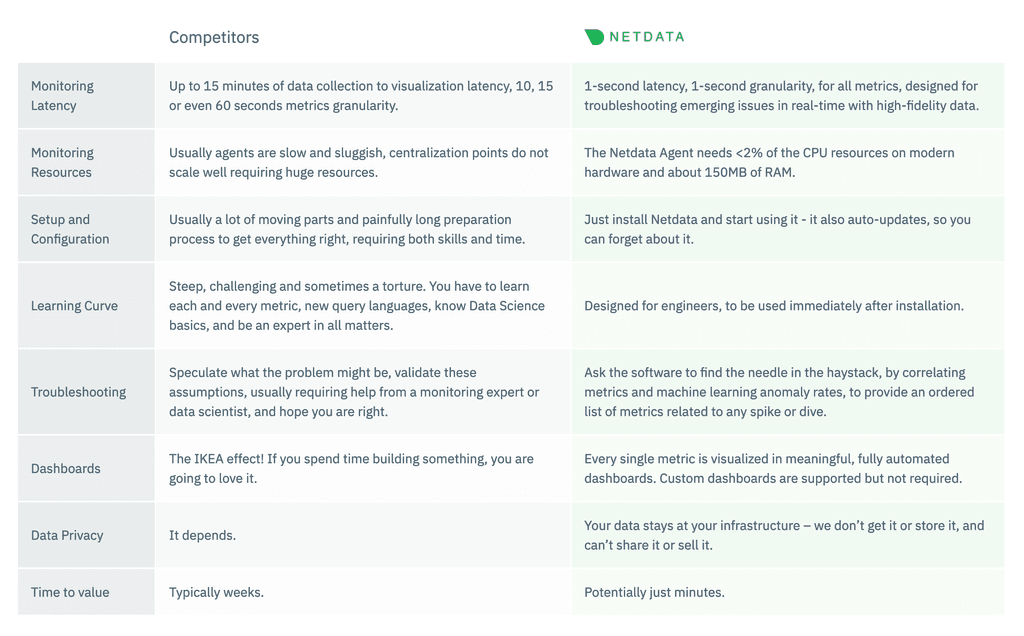
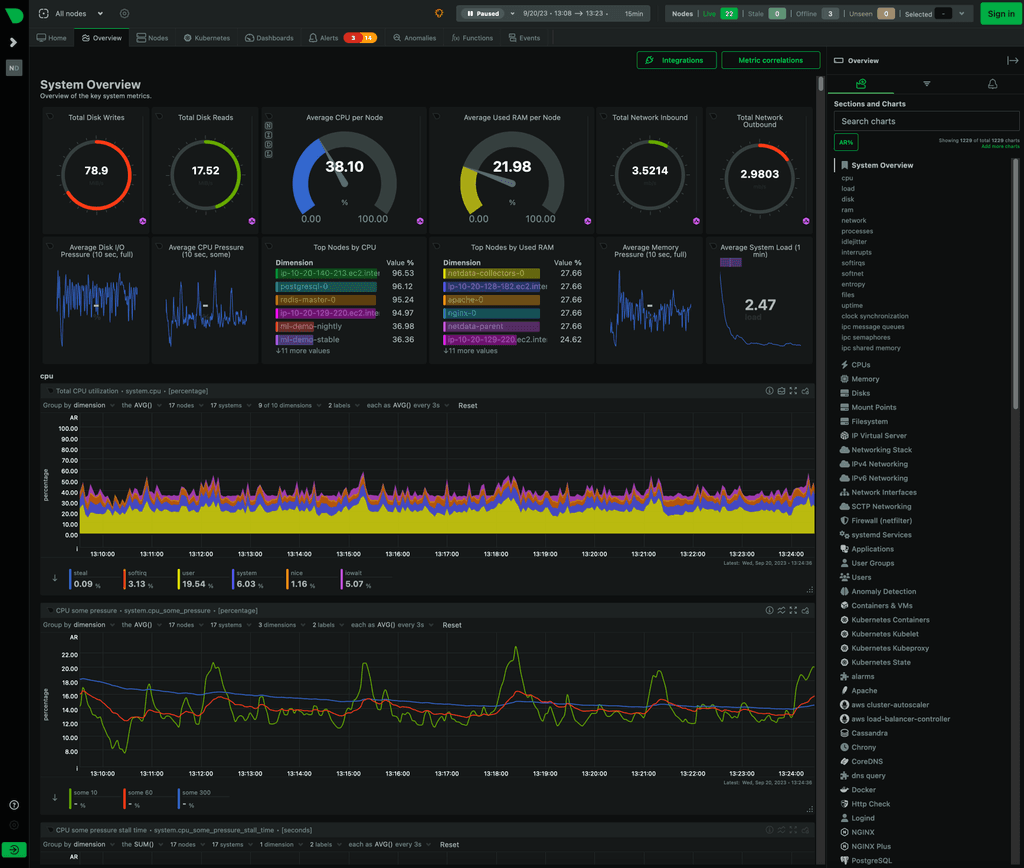
Any issues with including NetData on the root server and as an app add-on?
-
btw: the latest versions do have a local dashboard so you don't really need the (free) cloud dashboard anymore. It's even possible to install it in a docker container and access the local dashboard.
-
I think this will take a while for us. @imc67 what sort of official support are you expecting?
If it helps, I can put together a guide in our docs on how to use Cloudron with netdata. Pre-installing net data agent into every Cloudron installation is not under consideration at the moment.
-
I think this will take a while for us. @imc67 what sort of official support are you expecting?
If it helps, I can put together a guide in our docs on how to use Cloudron with netdata. Pre-installing net data agent into every Cloudron installation is not under consideration at the moment.
@girish after all these months and busy work on 7.5 I can imagine you can't remember our mail correspondence and the details of this thread.
Summary:
Many Cloudron users are longing for more detailed live data of their server @BrutalBirdie and I used to use Zabbix but it's difficult to get it work and updated. @marcusquinn discovered Netdata and I gave it a try on a RaspberryPi and was heavily impressed so I also "pre-installed" it on my new Cloudron server before migrating installing/migrating Cloudron. It works perfect and I already got many insights by Netdata triggers and Netdata AI of things that where wrong (i.e. crashed Cloudron firewall where Cloudron didn't warn me!).The big question by @robi, @timconsidine, @marcusquinn and me is: is it safe to install it on the server in a live Cloudron environment?
Second question: could it be an app candidate as it is available as a docker container, able to monitor the server itself including all other docker containers and has its own web dashboard? -
@girish after all these months and busy work on 7.5 I can imagine you can't remember our mail correspondence and the details of this thread.
Summary:
Many Cloudron users are longing for more detailed live data of their server @BrutalBirdie and I used to use Zabbix but it's difficult to get it work and updated. @marcusquinn discovered Netdata and I gave it a try on a RaspberryPi and was heavily impressed so I also "pre-installed" it on my new Cloudron server before migrating installing/migrating Cloudron. It works perfect and I already got many insights by Netdata triggers and Netdata AI of things that where wrong (i.e. crashed Cloudron firewall where Cloudron didn't warn me!).The big question by @robi, @timconsidine, @marcusquinn and me is: is it safe to install it on the server in a live Cloudron environment?
Second question: could it be an app candidate as it is available as a docker container, able to monitor the server itself including all other docker containers and has its own web dashboard?@imc67 Good questions. I think for @girish and @nebulon . I've only used it very occasionally, but not had any issues from it on a production server.
TBH I think it's a great feature addition, and helps make Cloudron more appealing to enterprise system admins.
Perhaps it could be presented in an iFrame in the Cloudron Dashboard, too, for a sort of integrated experience for the prosumer users.
-
As FOSS goes, this is exceptionally fortunate for the world to have available. I like their ethics, too:


-
I looked into this a bit. The installation adds a custom apt repo and sets up automatic update stuff and installs a few other things. In general, it probably doesn't break anything but I find it hard to gauge what it could potentially break. My understanding is this is similar to DigitalOcean's and AWS monitoring tools (which are optionally installed on the server) to provide dashboards. We have not heard of people facing issues when they install the tools.
I think the best approach here is to deal with issues as they appear @imc67 . What do you think? I can't think of any better way. We can't possibly track netdata releases or their installer code to understand what all changes are happening.
@girish I think the utility being sought here is Application/Service level resource usage data, as opposed to the overall general CPU/RAM that host monitoring presents. As in, when something is hogging resources, it can be identified, same for when something is allocated more than it needs.
-
Using the install script is not even necessary, as netdata can just as well be run as a container itself. So a simple
docker-compose.yamlwith the following is enough:version: '3' services: netdata: image: netdata/netdata container_name: netdata pid: host network_mode: host restart: unless-stopped cap_add: - SYS_PTRACE - SYS_ADMIN security_opt: - apparmor:unconfined volumes: - ./netdataconfig/netdata:/etc/netdata - netdatalib:/var/lib/netdata - netdatacache:/var/cache/netdata - /etc/passwd:/host/etc/passwd:ro - /etc/group:/host/etc/group:ro - /proc:/host/proc:ro - /sys:/host/sys:ro - /etc/os-release:/host/etc/os-release:ro #- /var/run/docker.sock:/var/run/docker.sock:ro environment: - DOCKER_HOST=127.0.0.1:2375 cetusguard: image: hectorm/cetusguard:v1 network_mode: host read_only: true volumes: - /var/run/docker.sock:/var/run/docker.sock:ro environment: CETUSGUARD_BACKEND_ADDR: unix:///var/run/docker.sock CETUSGUARD_FRONTEND_ADDR: tcp://:2375 CETUSGUARD_RULES: | ! Inspect a container GET %API_PREFIX_CONTAINERS%/%CONTAINER_ID_OR_NAME%/json volumes: netdatalib: netdatacache:Afterwards one can just create an app proxy to
http://127.0.0.1:19999and netdata can be "publicly" reached.The above
docker-compose.yamlactually comes from the netdata documentation. -
@fbartels ah nice, cetusguard is a great find. Haven't heard of that before! We have our own internal docker proxy protector which does similar.
-
Using the install script is not even necessary, as netdata can just as well be run as a container itself. So a simple
docker-compose.yamlwith the following is enough:version: '3' services: netdata: image: netdata/netdata container_name: netdata pid: host network_mode: host restart: unless-stopped cap_add: - SYS_PTRACE - SYS_ADMIN security_opt: - apparmor:unconfined volumes: - ./netdataconfig/netdata:/etc/netdata - netdatalib:/var/lib/netdata - netdatacache:/var/cache/netdata - /etc/passwd:/host/etc/passwd:ro - /etc/group:/host/etc/group:ro - /proc:/host/proc:ro - /sys:/host/sys:ro - /etc/os-release:/host/etc/os-release:ro #- /var/run/docker.sock:/var/run/docker.sock:ro environment: - DOCKER_HOST=127.0.0.1:2375 cetusguard: image: hectorm/cetusguard:v1 network_mode: host read_only: true volumes: - /var/run/docker.sock:/var/run/docker.sock:ro environment: CETUSGUARD_BACKEND_ADDR: unix:///var/run/docker.sock CETUSGUARD_FRONTEND_ADDR: tcp://:2375 CETUSGUARD_RULES: | ! Inspect a container GET %API_PREFIX_CONTAINERS%/%CONTAINER_ID_OR_NAME%/json volumes: netdatalib: netdatacache:Afterwards one can just create an app proxy to
http://127.0.0.1:19999and netdata can be "publicly" reached.The above
docker-compose.yamlactually comes from the netdata documentation. -
For Netdata to work well, it has to run like it runs on the host itself i.e without a sandbox. If you see https://learn.netdata.cloud/docs/installing/docker#recommended-way or the compose file @fbartels posted, it is giving access to proc, etc, sys of the host and docker access. This is security risk (or not) depending on whether you trust netdata. Cloudron apps don't have access to any of these things.
-
Using the install script is not even necessary, as netdata can just as well be run as a container itself. So a simple
docker-compose.yamlwith the following is enough:version: '3' services: netdata: image: netdata/netdata container_name: netdata pid: host network_mode: host restart: unless-stopped cap_add: - SYS_PTRACE - SYS_ADMIN security_opt: - apparmor:unconfined volumes: - ./netdataconfig/netdata:/etc/netdata - netdatalib:/var/lib/netdata - netdatacache:/var/cache/netdata - /etc/passwd:/host/etc/passwd:ro - /etc/group:/host/etc/group:ro - /proc:/host/proc:ro - /sys:/host/sys:ro - /etc/os-release:/host/etc/os-release:ro #- /var/run/docker.sock:/var/run/docker.sock:ro environment: - DOCKER_HOST=127.0.0.1:2375 cetusguard: image: hectorm/cetusguard:v1 network_mode: host read_only: true volumes: - /var/run/docker.sock:/var/run/docker.sock:ro environment: CETUSGUARD_BACKEND_ADDR: unix:///var/run/docker.sock CETUSGUARD_FRONTEND_ADDR: tcp://:2375 CETUSGUARD_RULES: | ! Inspect a container GET %API_PREFIX_CONTAINERS%/%CONTAINER_ID_OR_NAME%/json volumes: netdatalib: netdatacache:Afterwards one can just create an app proxy to
http://127.0.0.1:19999and netdata can be "publicly" reached.The above
docker-compose.yamlactually comes from the netdata documentation.@fbartels said in Any issues with including NetData on the root server and as an app add-on?:
Afterwards one can just create an app proxy to http://127.0.0.1:19999 and netdata can be "publicly" reached.
I just installed Netdata (stable) on another Cloudron production server. Installation went well, connection to Netdata cloud dashboard went well and indeed as @fbartels wrote, the "app proxy" works also to have a local only view!
Perfect!
-
@fbartels said in Any issues with including NetData on the root server and as an app add-on?:
Afterwards one can just create an app proxy to http://127.0.0.1:19999 and netdata can be "publicly" reached.
I just installed Netdata (stable) on another Cloudron production server. Installation went well, connection to Netdata cloud dashboard went well and indeed as @fbartels wrote, the "app proxy" works also to have a local only view!
Perfect!
-
@imc67 I understood, that installing netdata via the Kickstart command is not a bad thing to do?
https://learn.netdata.cloud/docs/installing/one-line-installer-for-all-linux-systems
ofc, taking into account, that messing with the system like that deviates from what is suggested for obvious reasons by Cloudron and is in my responsibility.
-
Looks like we got our first support ticket related to installing netdata. I have not verified this but it seems that installing netdata installs the nodejs package which ends up downgrading nodejs to v12 . This in turn prevents Cloudron from starting up.
It's better to install netdata via Docker, atleast it would prevent the above issue.
Hello! It looks like you're interested in this conversation, but you don't have an account yet.
Getting fed up of having to scroll through the same posts each visit? When you register for an account, you'll always come back to exactly where you were before, and choose to be notified of new replies (either via email, or push notification). You'll also be able to save bookmarks and upvote posts to show your appreciation to other community members.
With your input, this post could be even better 💗
Register Login
