Cloudron makes it easy to run web apps like WordPress, Nextcloud, GitLab on your server. Find out more or install now.


Skip to content

Grafana

20 Topics 210 Posts
  • Grafana - Package Updates

    Pinned
    123
    1 Votes
    123 Posts
    26k Views
    Package UpdatesP

    [1.27.1]

    Update grafana to 11.3.1 Full Changelog Alerting: Make context deadline on AlertNG service startup configurable #​96135, @​fayzal-g MigrationAssistant: Restrict dashboards, folders and datasources by the org id of the signed in user #​96345, @​leandro-deveikis User: Check SignedInUser OrgID in RevokeInvite #​95490, @​mgyongyosi Alerting: Fix escaping of silence matchers in utf8 mode #​95347, @​tomratcliffe Alerting: Fix overflow for long receiver names #​95133, @​gillesdemey
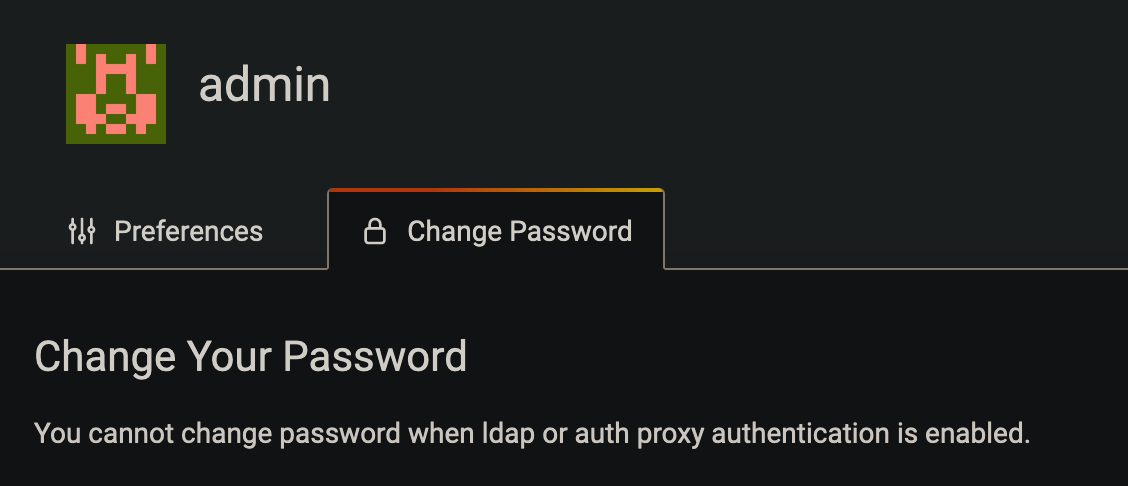
  • You can change the username but not the password

    Solved
    12
    0 Votes
    12 Posts
    1k Views
    A

    I think I probably closed the modal too quickly and missed that. And then I couldn't find it back.
    I'm not on Cloudron 8 yet, but good to know discovery has been improved!

    Taking note of the "First Time Setup", I hadn't known that was there!

  • Add MariaDB and Setup as Replica

    5
    1 Votes
    5 Posts
    317 Views
    girishG

    @brianb said in Add MariaDB and Setup as Replica:

    Can't I just create a mysql database in the grafana once it is setup in cloundron?

    Not sure what you mean here. Are you referring to Grafana's database (https://grafana.com/docs/grafana/latest/setup-grafana/configure-grafana/#database) or Grafana's data source (https://grafana.com/docs/grafana/latest/datasources/mysql/)

    On Cloudron, Grafana's database cannot be changed. It uses PostgreSQL internally.

    If you are referring to data source, then yes, you can can mysql database data source. But I referred to MariaDB only because you mentioned MariaDB in your initial post (in fact, there is no mention of MySQL there).

  • 0 Votes
    2 Posts
    238 Views
    L

    Loki / Promtail

    Loki requires Promtail.

    Loki is available as a Grafana plugin, and includes the binaries for Promtail. Also, the plugin is included with the installation, so no additional installation is required:

    https://grafana.com/grafana/plugins/loki/?tab=installation

    Tempo
    Tempo is included in Grafana by default:
    https://grafana.com/grafana/plugins/tempo/?tab=installation

    Prometheus
    This is available as a Cloudron package

  • 0 Votes
    2 Posts
    160 Views
    girishG

    @dsp76 internally, the IP addresses are hardcoded. The apps and databases reside in the same internal network, so you don't need a SSH tunnel. The addresses are listed in https://docs.cloudron.io/networking/#internal-network

  • Zabbix Plugin not found

    Solved
    12
    0 Votes
    12 Posts
    1k Views
    L

    @girish said in Zabbix Plugin not found:

    @Lanklan to restart the app , go to repair tab of the app and click on the restart button.

    image.png

    After that, I can see zabbix:

    image.png

    Already done it but i don't know why it's appared after several restart !

  • Not Able to Login in Grafana Using Cloudron LDAP

    Solved
    11
    0 Votes
    11 Posts
    374 Views
    Jan MacenkaJ

    I did not finaly figure out what it was but was able to revert back to a backup-state that worked.
    Ended up just creating a new Grafana App and manually transfered all settings. Not it appears to be working fine.
    So probably I screwed up somewhere but it does not seem to be a bigger Application issue.

  • This topic is deleted!

    2
    0 Votes
    2 Posts
    10 Views
  • How to add Prometheus data source to Grafana?

    5
    0 Votes
    5 Posts
    4k Views
    jdaviescoatesJ

    @Jan-Macenka I see you worked that out:

    @Jan-Macenka said in Prometheus + Grafana actually working:

    just had the same issue and wanted to add something here as a documentation:

    If both Grafana and Prometheus are running as a cloudron-app, you can add Prometheus as a data-source in Grafana by inputting http://<PROMETHEUS-SERVICE-UUID>:9090 in the URL-field where PROMETHEUS-SERVICE-UUID can be found form the prometheus container either by looking up its installation location in the Storage-Tab or by connecting via terminal and copying the hostname.

    Cheers,
    Jan

  • Grafana and jira-grafana-json-datasource

    3
    0 Votes
    3 Posts
    640 Views
    GrienauerG

    @subven thx for your input!

  • Grafana email alerts not working

    Moved Solved
    4
    0 Votes
    4 Posts
    1k Views
    O

    @girish thanks a lot! I can confirm that its working now. 👍

  • InfluxDB -> Network Error: (502)

    5
    0 Votes
    5 Posts
    984 Views
    M

    @brutalbirdie

    Ahhhhh sorry - I thought when I added these things via the app - it would install the items needed.

    I need to install InfluxDB and then link it. 🙂

    Cheers

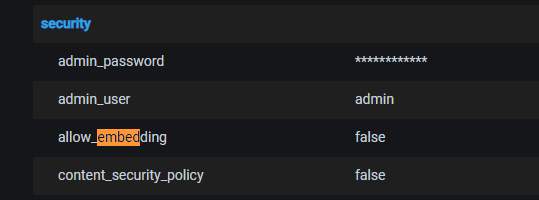
  • Grafana = allow_embedding - false

    Moved
    3
    0 Votes
    3 Posts
    602 Views
    M

    @girish worked like a charm! Thanks!

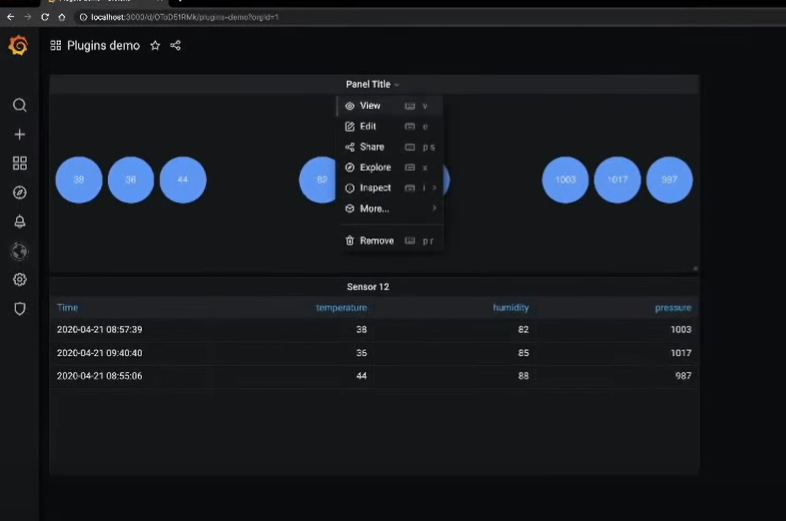
  • Granana - Panel Editor

    Moved Solved
    2
    0 Votes
    2 Posts
    421 Views
    M

    @my1water it appears to be a one off issue with the screen sharing session I was using while trying to configure the dashboard - this can be closed, thanks!

  • This topic is deleted!

    1
    0 Votes
    1 Posts
    2 Views
    No one has replied
  • How to monitor Cloudron and Cloudron-apps with Grafana ?

    6
    2 Votes
    6 Posts
    974 Views
    JOduMonTJ

    @jimcavoli said in How to monitor Cloudron and Cloudron-apps with Grafana ?:

    fed via collectd in case you're curious

    but maybe I should focus on Collectd since my goal is to monitor IPTables

  • Unable to install plugins

    Solved
    3
    0 Votes
    3 Posts
    1k Views
    girishG

    @ChristopherMag This should be fixed now with the latest package. I found that we have to set GF_PLUGIN_DIR env var or pass --pluginDir separately for the CLI tool. The server reads configs from custom.ini but the CLI does not (there's probably some good reason for this discrepancy).

  • Safe to replace admin user?

    Solved
    5
    0 Votes
    5 Posts
    604 Views
    yusfY

    @girish said in Safe to replace admin user?:

    It's best to keep the original admin user

    Duly noted. 😅

    never have to login again after giving your Cloudron user admin previliges.

    Yeah, oddly enough I found the LDAP setting in my new admin user as well now, so the whole thing might've been a brainfart on my part.

  • Graph server logs files in the context of cloudron ?

    2
    0 Votes
    2 Posts
    328 Views
    girishG

    Is there anything in the logs? I have never used Loki, so not sure what could be going wrong. Are you able to add other sources or just loki is the problem?

  • Grafana migration instructions check

    2
    0 Votes
    2 Posts
    369 Views
    girishG

    Right, /app/data/custom.ini is where the users customizations go. What db were you using in your existing installation? The cloudron package uses postgres. To get the DB connection credentials, you can go to the Terminal of the app and do env | grep CLOUDRON_POSTGRES. You can also click the postgres button on the top and it will paste the CLI needed to access postgres.