Cloudron makes it easy to run web apps like WordPress, Nextcloud, GitLab on your server. Find out more or install now.


Skip to content

Grafana

21 Topics 226 Posts
  • Grafana - Package Updates

    Pinned
    133
    1 Votes
    133 Posts
    45k Views
    Package UpdatesP
    [1.31.0] Update grafana to 11.6.0 Full Changelog API keys: Migrate API keys to service accounts at startup #96924, @dmihai AccessControl: Allow plugin roles to include plugins:write #101089, @gamab Alerting: Add DAG errors to alert rule creation and view #99423, @soniaAguilarPeiron Alerting: Add Jira integration to cloud AMs #100482, @soniaAguilarPeiron Alerting: Add alert rule version history - part1 #99490, @soniaAguilarPeiron Alerting: Add migration to clean up rule versions table #102562, @yuri-tceretian Alerting: Add multiple threshold operators #99516, @paulojmdias Alerting: Add tracking for the mode used in query and notifications step when c #100824, @soniaAguilarPeiron Alerting: Adding color option for slack receiver #99615, @wymangr Alerting: Allow selection of recording rule write target on per-rule basis. #101778, @stevesg
  • Unable to Connect Grafana to Graphite

    6
    1 Votes
    6 Posts
    183 Views
    A
    I'm using Grafana's internal plugin to connect to Graphite, so the process should be straightforward. However, I will explore alternative methods to obtain the server metrics. Thanks!
  • You can change the username but not the password

    Solved
    12
    1
    0 Votes
    12 Posts
    2k Views
    A
    I think I probably closed the modal too quickly and missed that. And then I couldn't find it back. I'm not on Cloudron 8 yet, but good to know discovery has been improved! Taking note of the "First Time Setup", I hadn't known that was there!
  • Add MariaDB and Setup as Replica

    5
    1 Votes
    5 Posts
    538 Views
    girishG
    @brianb said in Add MariaDB and Setup as Replica: Can't I just create a mysql database in the grafana once it is setup in cloundron? Not sure what you mean here. Are you referring to Grafana's database (https://grafana.com/docs/grafana/latest/setup-grafana/configure-grafana/#database) or Grafana's data source (https://grafana.com/docs/grafana/latest/datasources/mysql/) 
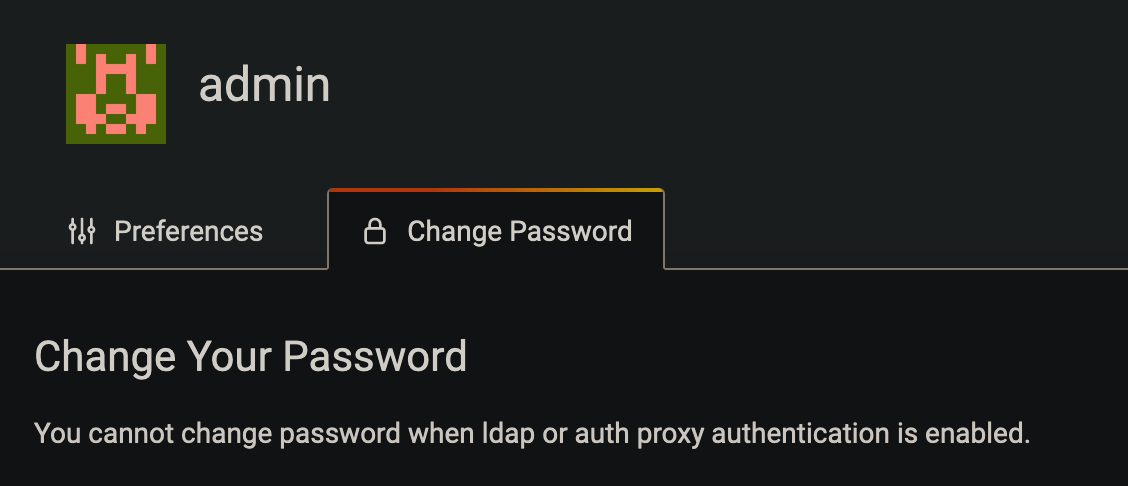
On Cloudron, Grafana's database cannot be changed. It uses PostgreSQL internally. If you are referring to data source, then yes, you can can mysql database data source. But I referred to MariaDB only because you mentioned MariaDB in your initial post (in fact, there is no mention of MySQL there).
  • 0 Votes
    2 Posts
    370 Views
    L
    Loki / Promtail Loki requires Promtail. Loki is available as a Grafana plugin, and includes the binaries for Promtail. Also, the plugin is included with the installation, so no additional installation is required: https://grafana.com/grafana/plugins/loki/?tab=installation Tempo Tempo is included in Grafana by default: https://grafana.com/grafana/plugins/tempo/?tab=installation Prometheus This is available as a Cloudron package
  • 0 Votes
    2 Posts
    255 Views
    girishG
    @dsp76 internally, the IP addresses are hardcoded. The apps and databases reside in the same internal network, so you don't need a SSH tunnel. The addresses are listed in https://docs.cloudron.io/networking/#internal-network
  • Zabbix Plugin not found

    Solved
    12
    1
    0 Votes
    12 Posts
    2k Views
    L
    @girish said in Zabbix Plugin not found: @Lanklan to restart the app , go to repair tab of the app and click on the restart button. [image: 1699027637321-7e4f6ece-6eac-4f86-a529-033d7990d2e1-image-resized.png] After that, I can see zabbix: [image: 1699028055536-d140d3f7-2708-4728-a0f2-5de5e4535ba1-image-resized.png] Already done it but i don't know why it's appared after several restart !
  • Not Able to Login in Grafana Using Cloudron LDAP

    Solved
    11
    0 Votes
    11 Posts
    444 Views
    Jan MacenkaJ
    I did not finaly figure out what it was but was able to revert back to a backup-state that worked. Ended up just creating a new Grafana App and manually transfered all settings. Not it appears to be working fine. So probably I screwed up somewhere but it does not seem to be a bigger Application issue.
  • This topic is deleted!

    2
    0 Votes
    2 Posts
    10 Views
  • How to add Prometheus data source to Grafana?

    5
    0 Votes
    5 Posts
    4k Views
    jdaviescoatesJ
    @Jan-Macenka I see you worked that out: @Jan-Macenka said in Prometheus + Grafana actually working: just had the same issue and wanted to add something here as a documentation: If both Grafana and Prometheus are running as a cloudron-app, you can add Prometheus as a data-source in Grafana by inputting http://<PROMETHEUS-SERVICE-UUID>:9090 in the URL-field where PROMETHEUS-SERVICE-UUID can be found form the prometheus container either by looking up its installation location in the Storage-Tab or by connecting via terminal and copying the hostname. Cheers, Jan
  • Grafana and jira-grafana-json-datasource

    3
    0 Votes
    3 Posts
    846 Views
    GrienauerG
    @subven thx for your input!
  • Grafana email alerts not working

    Moved Solved
    4
    0 Votes
    4 Posts
    2k Views
    O
    @girish thanks a lot! I can confirm that its working now.
  • InfluxDB -> Network Error: (502)

    5
    0 Votes
    5 Posts
    1k Views
    M
    @brutalbirdie Ahhhhh sorry - I thought when I added these things via the app - it would install the items needed. I need to install InfluxDB and then link it. Cheers
  • Grafana = allow_embedding - false

    Moved
    3
    1
    0 Votes
    3 Posts
    788 Views
    M
    @girish worked like a charm! Thanks!
  • Granana - Panel Editor

    Moved Solved
    2
    1
    0 Votes
    2 Posts
    565 Views
    M
    @my1water it appears to be a one off issue with the screen sharing session I was using while trying to configure the dashboard - this can be closed, thanks!
  • This topic is deleted!

    1
    0 Votes
    1 Posts
    2 Views
    No one has replied
  • How to monitor Cloudron and Cloudron-apps with Grafana ?

    6
    2 Votes
    6 Posts
    1k Views
    JOduMonTJ
    @jimcavoli said in How to monitor Cloudron and Cloudron-apps with Grafana ?: fed via collectd in case you're curious but maybe I should focus on Collectd since my goal is to monitor IPTables
  • Unable to install plugins

    Solved
    3
    0 Votes
    3 Posts
    1k Views
    girishG
    @ChristopherMag This should be fixed now with the latest package. I found that we have to set GF_PLUGIN_DIR env var or pass --pluginDir separately for the CLI tool. The server reads configs from custom.ini but the CLI does not (there's probably some good reason for this discrepancy).
  • Safe to replace admin user?

    Solved
    5
    0 Votes
    5 Posts
    845 Views
    yusfY
    @girish said in Safe to replace admin user?: It's best to keep the original admin user Duly noted. never have to login again after giving your Cloudron user admin previliges. Yeah, oddly enough I found the LDAP setting in my new admin user as well now, so the whole thing might've been a brainfart on my part.
  • Graph server logs files in the context of cloudron ?

    2
    0 Votes
    2 Posts
    461 Views
    girishG
    Is there anything in the logs? I have never used Loki, so not sure what could be going wrong. Are you able to add other sources or just loki is the problem?