Yeah, deep in the rabbit hold on research on this. There's nothing that distracts me more than something that has a score attached to it (not competitive all all )
Trying to get a clean sheet of green on this:
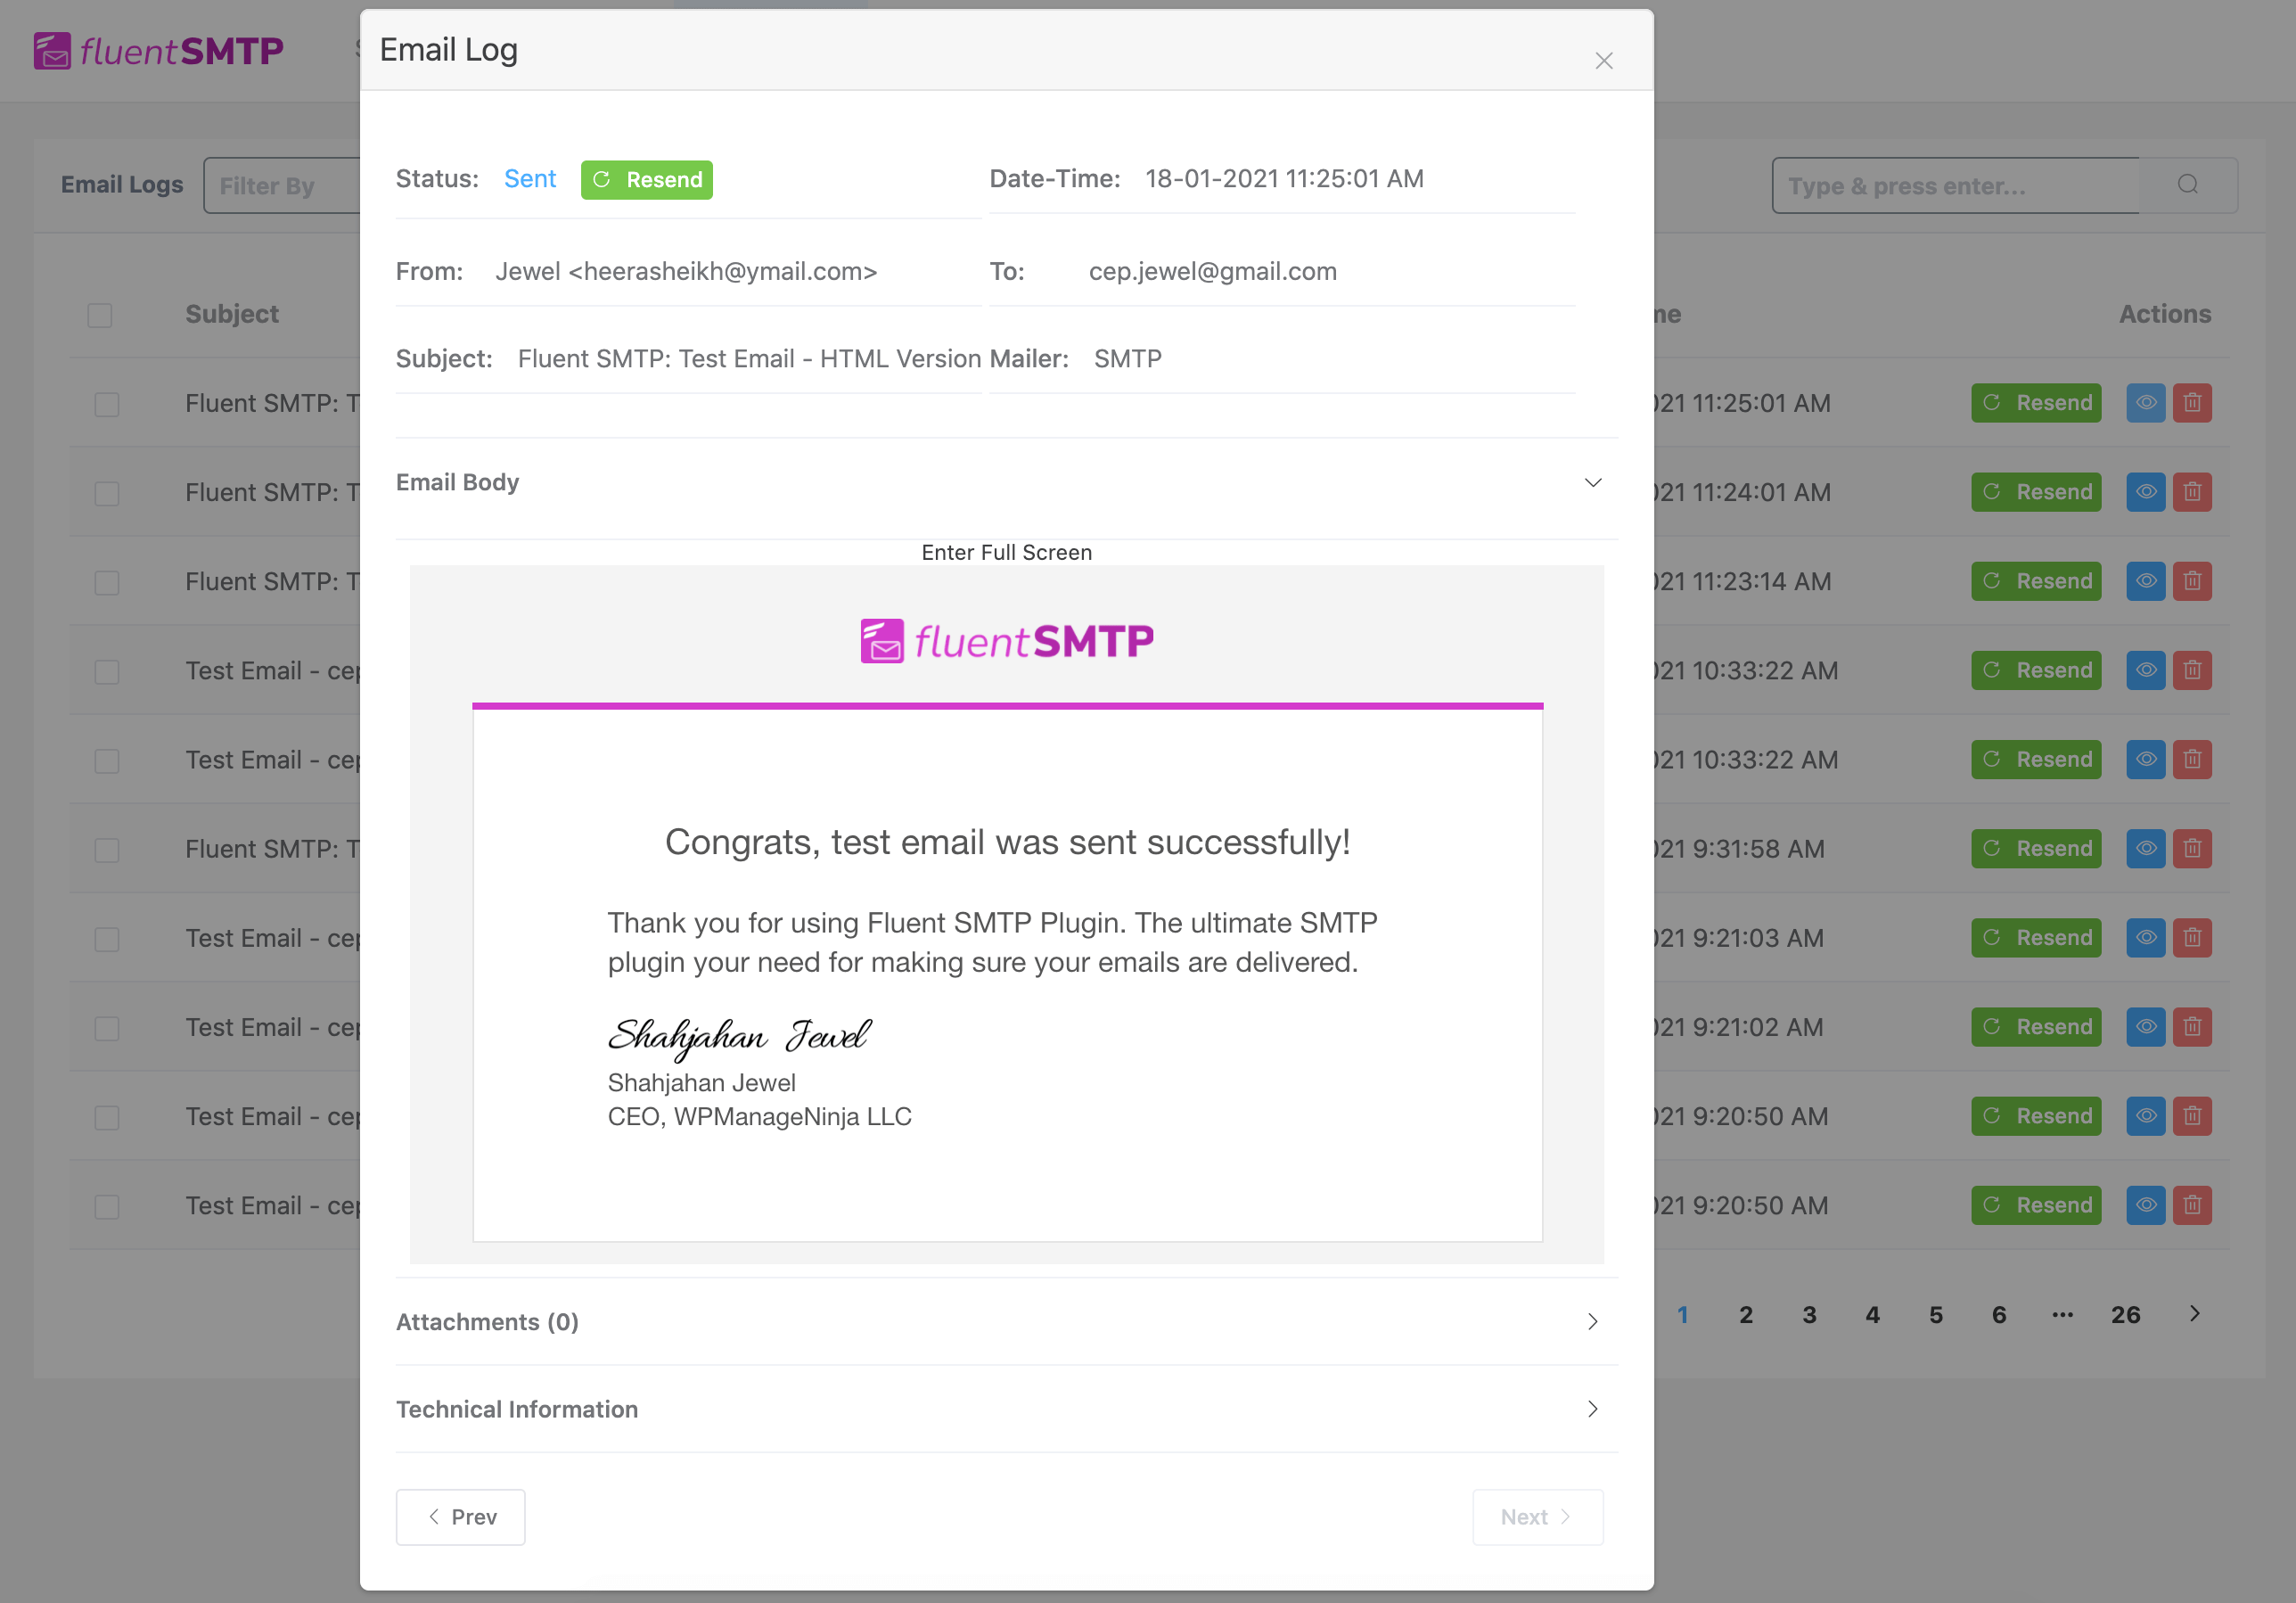
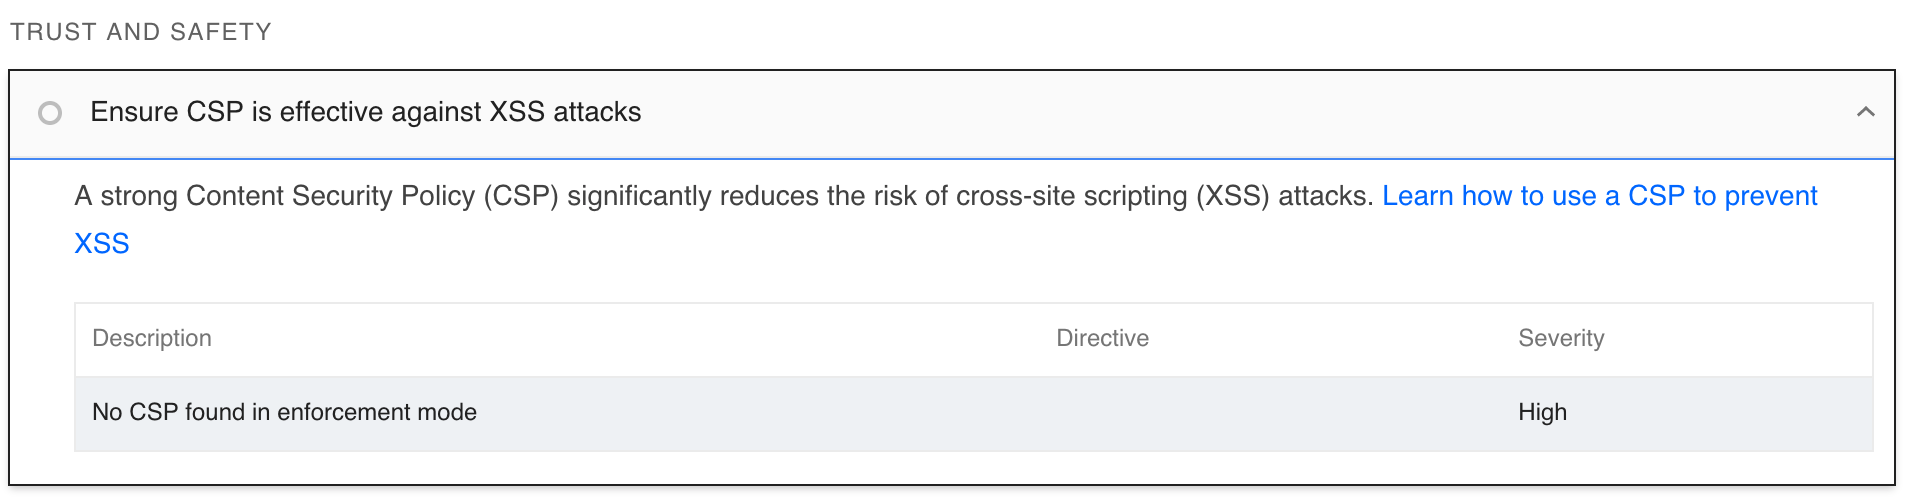
https://inspectwp.com
Given WordPress is perhaps the most popular self-hosted app of all, be great to have the Cloudron setup as perfect as possible, particularly for WordPress. So many more expensive options out there charging per site. Lots of wins possible from being able to proclaim the best WP setup possible
On an unrelated note, there's an option in WP dash > Updates to have it auto-install new releases. I noticed some of my sites have that enabled and some don't. It's not a problem, but I mention it because maybe that should be disabled/hidden somehow since this should be handled by the packaging updates.
[image: 1691756574714-7b6d84ab-4d00-427f-bc17-a79a1bc1f546-image.png]
Edit: just noticed your latest reply, so I guess WP was auto-updating most of my sites and I thought the packaging was doing that.
Yet, it's very simple to install so I can't see why you went through all the hops.
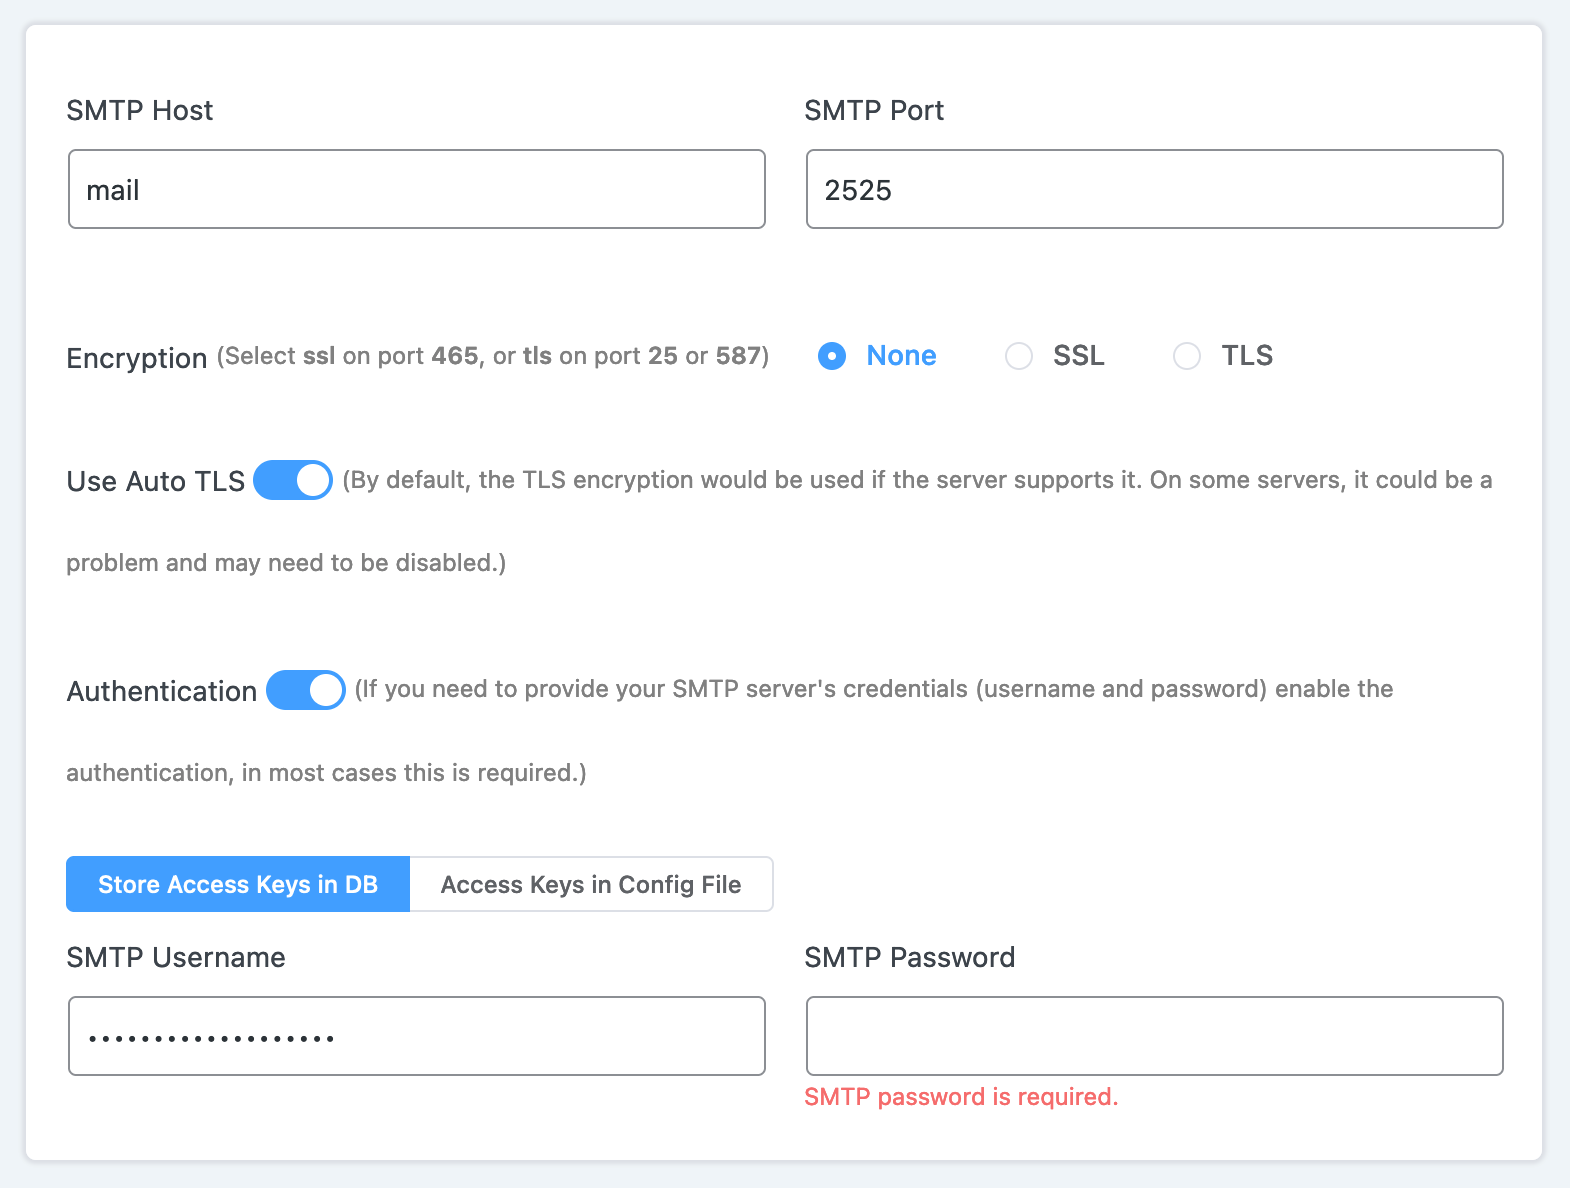
Just install the plugin, then put in the SMTP credentials found in credentials.txt in the app root in "Other SMTP", done. Host is Mail, port 2525 no SSL nor TLS.
@girish said in ECONNREFUSED:
@MarchinBunny there was a malware in WordPress. Something like https://stackoverflow.com/questions/76268370/wordpress-error-because-mo-files-inside-wp-include .
Exactly, what I expected right from the start of the thread.
But there are lots of plugins in your site, it could be anything.
And, yes some malware could be running in the background for years before one find out.
@RazielKanos said in Malware in my Wordpress:
Once a system was infected it is best to set up everything new
And above all, DO NOT install themes and/or plugins which provenance is doubtful.
In WordPress this is 99% the source of 'malware' problems.
@marcusquinn I use these commands, via Terminal MySQL Access:
//display active users
select user_login, user_nicename, display_name from wp_users;
//change user_nicename
UPDATE wp_users SET user_nicename = 'myusername' WHERE user_nicename = 'admin';
//change user_login
UPDATE wp_users SET user_login = 'myusername' WHERE user_login = 'admin';
//change display_name
UPDATE wp_users SET display_name = 'myusername' WHERE display_name = 'admin';
//change user email
UPDATE `wp_users` SET `user_email` = "myemail@email.com" WHERE `wp_users`.`user_login` = "myusername";
//change admin password
UPDATE WORDPRESSDATABASE.wp_users SET user_pass = MD5('NEWPASSWORD') WHERE user_login = 'myusername';
@girish Thanks, that makes some memory-saving sense, too. My specific issue was just at having the addon enabled, but the plugin disabled, as it makes sense to have it on a live site that isn't being developed, but not during development.
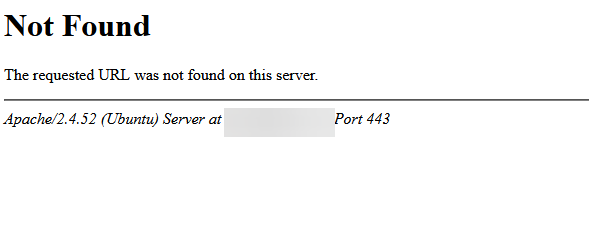
@BrutalBirdie You're right, directory browsing is blocked at the server level. I just spotted these missing files and thought a simple no-harm way to cover the same for all instances.
check out in the options table. I once had a hacked plugin that was writing executable code in the options table, and by that, it was able to reinstall itself again and again.
Well securing the page should be a matter of less than an hour. Just export those pages, make a fresh install and import the pages back in
@humptydumpty Nothing to feel bad for. That's just how GPL works. Plenty of non-GPL platforms they could develop for and not benefit from the size of the market. Microsoft does just fine with a % of unlicensed users, it's just a marketing cost. At the end of the day utility and user counts is worth more. The plugin with 700,000 installs registering on wordpress.org will be getting ample monetisation opportunities. The one with 70 installs likely won't be worth any GPL site unlocking.