Cloudron makes it easy to run web apps like WordPress, Nextcloud, GitLab on your server. Find out more or install now.


Skip to content
  • Graphs error with Volumes

    Solved Support graphs volumes
    11
    1
    0 Votes
    11 Posts
    2k Views
    girishG
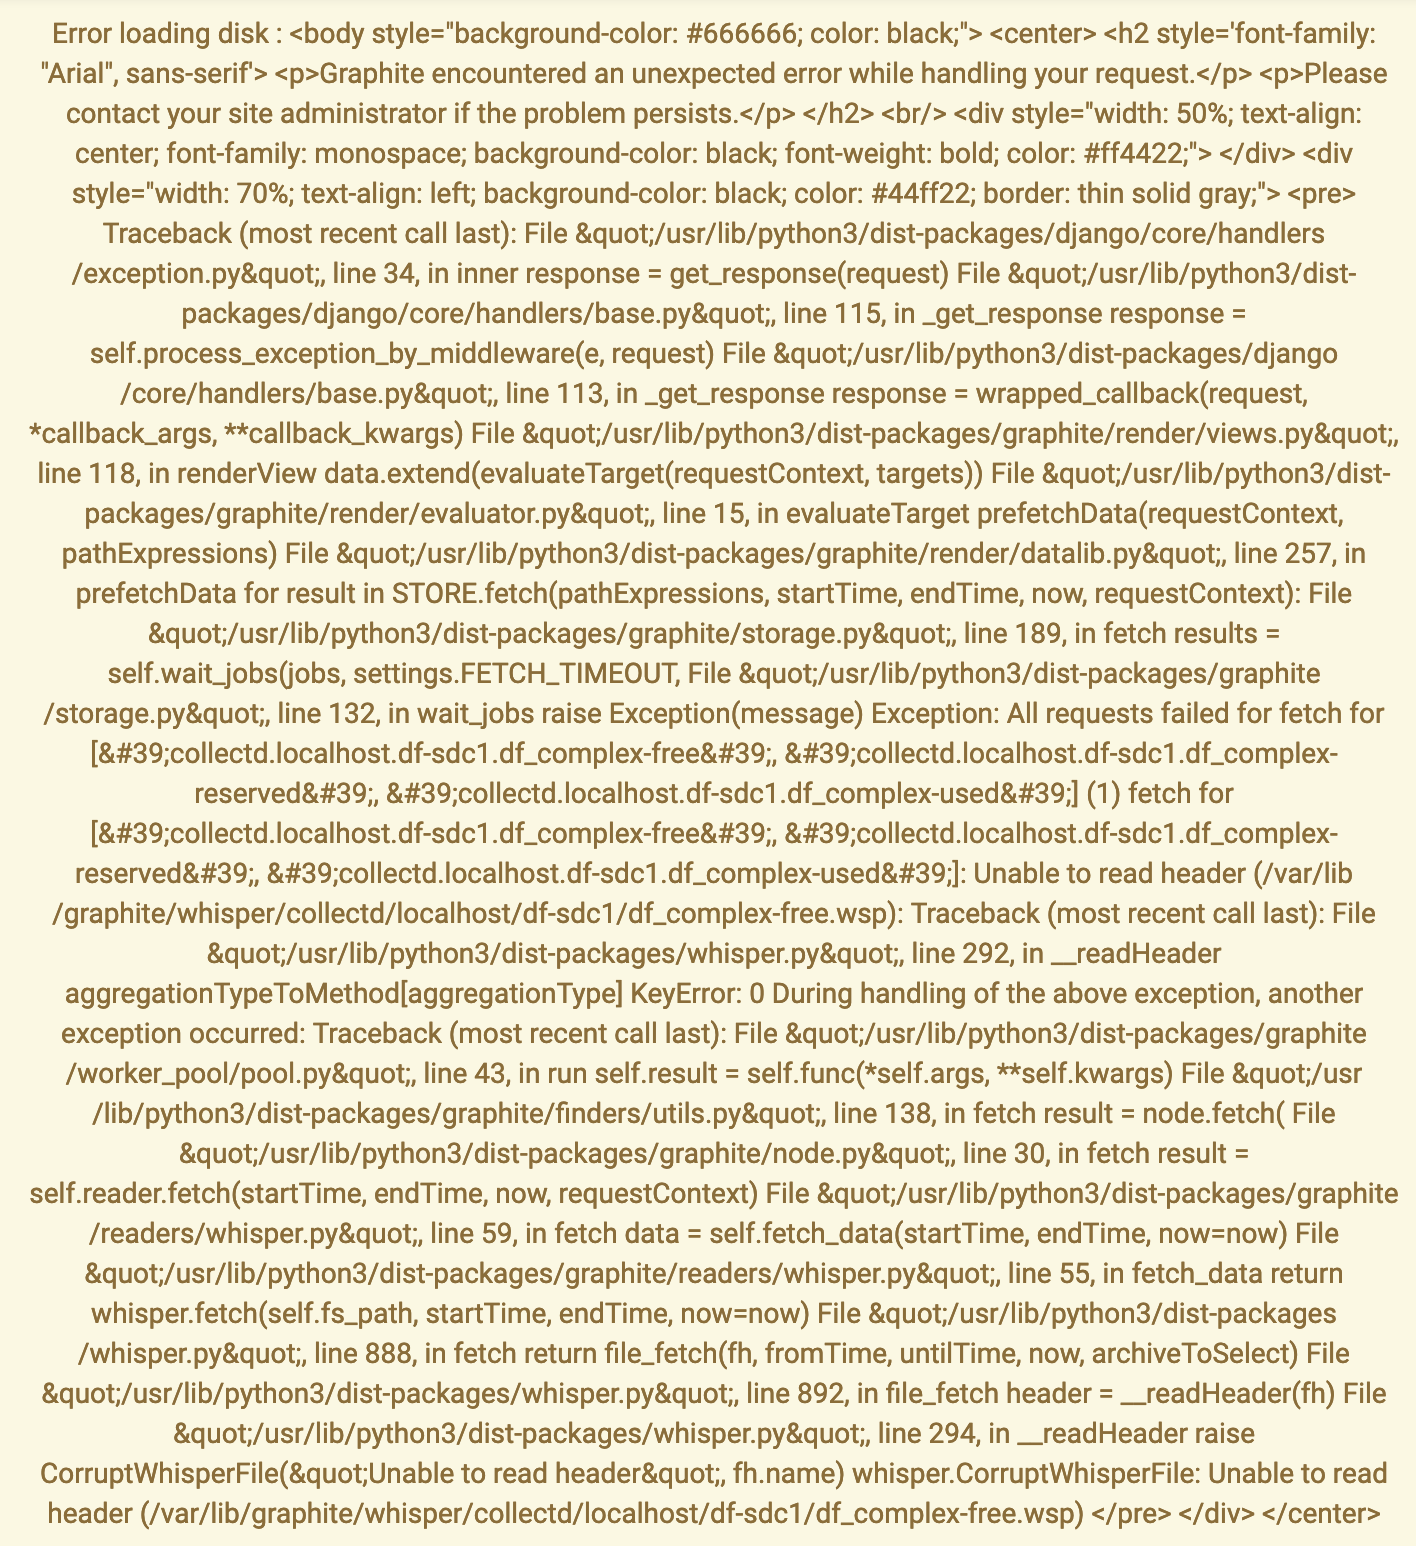
    The full stack trace is: 16/07/2021 17:58:24 :: [console] Error writing to collectd.localhost.df-sdc1.df_complex-used: Unable to read header (/var/lib/graphite/whisper/collectd/localhost/df-sdc1/df_complex-used.wsp) 16/07/2021 17:58:24 :: [console] Unhandled Error Traceback (most recent call last): File "/usr/lib/python3/dist-packages/twisted/python/threadpool.py", line 266, in <lambda> inContext.theWork = lambda: context.call(ctx, func, *args, **kw) File "/usr/lib/python3/dist-packages/twisted/python/context.py", line 122, in callWithContext return self.currentContext().callWithContext(ctx, func, *args, **kw) File "/usr/lib/python3/dist-packages/twisted/python/context.py", line 85, in callWithContext return func(*args,**kw) File "/usr/lib/python3/dist-packages/carbon/writer.py", line 189, in writeForever writeCachedDataPoints() --- <exception caught here> --- File "/usr/lib/python3/dist-packages/carbon/writer.py", line 165, in writeCachedDataPoints state.database.write(metric, datapoints) File "/usr/lib/python3/dist-packages/carbon/database.py", line 124, in write whisper.update_many(path, datapoints) File "/usr/lib/python3/dist-packages/whisper.py", line 740, in update_many return file_update_many(fh, points, now) File "/usr/lib/python3/dist-packages/whisper.py", line 747, in file_update_many header = __readHeader(fh) File "/usr/lib/python3/dist-packages/whisper.py", line 294, in __readHeader raise CorruptWhisperFile("Unable to read header", fh.name) whisper.CorruptWhisperFile: Unable to read header (/var/lib/graphite/whisper/collectd/localhost/df-sdc1/df_complex-free.wsp) 
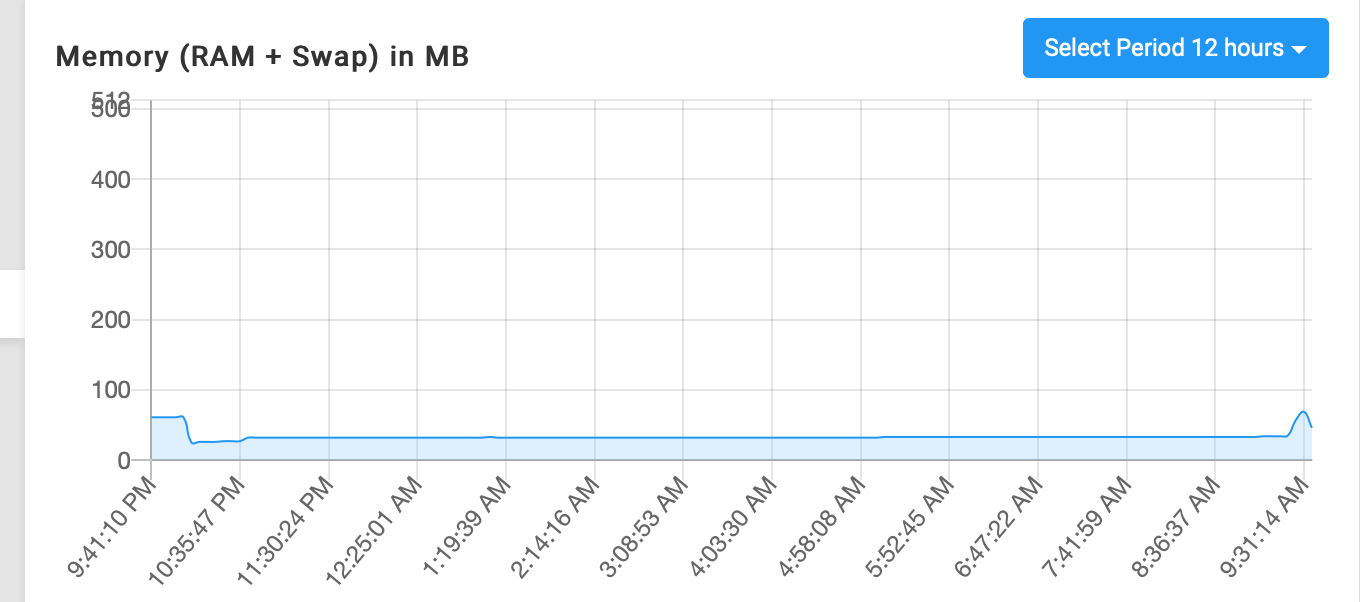
The last line gives a hint that the graphite file is corrupt. So, I removed all the whisper files in /home/yellowtent/platformdata/graphite/whisper/collectd/localhost/df-sdc1 and graphs seems to work after that. 
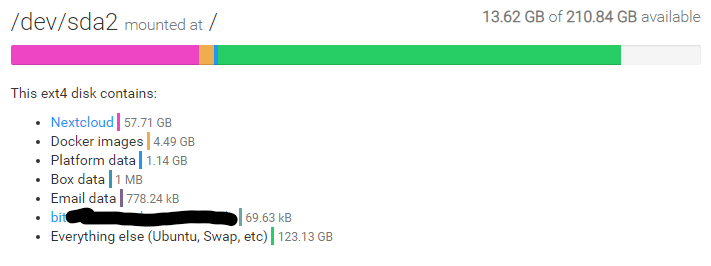
@atridad Maybe a good idea to check the health of the hard disk ? Also, since we hit the systemd issue on the same server.
  • Nextcloud : disk usage anomaly

    Solved Nextcloud disk usage graphs
    4
    1
    0 Votes
    4 Posts
    1k Views
    timconsidineT
    @nebulon Yep, thank you, confirmed it reset itself. Took >24 hours for recalculation but it is sorted
  • Graphite keeps crashing OOM

    Solved Support graphs oom
    37
    0 Votes
    37 Posts
    6k Views
    girishG
    @rmdes yes, I am not sure why. It doesn't happen in any of our demo servers or managed services. Quite strange. It could also be that maybe others have hit it but have not noticed it (since it only causes a CPU spike..) but clearly it's a bug since it's been fixed upstream.
  • 0 Votes
    2 Posts
    607 Views
    girishG
    @stoccafisso I think I am able to reproduce this in one of our managed Cloudrons. Looking into the fix.
  • 0 Votes
    6 Posts
    1k Views
    d19dotcaD
    @girish I guess I'm wondering though why it'd say "Not available yet"... is that because I had restarted the server a few hours earlier? I don't normally notice that though when I restart, it usually still shows data. Is it possible there's a bug here? If the restarts are losing that data, then I'd think that's a bug, right, if it shows for some services but not all? To me that makes it seems like it's either not completing properly when it runs and that could maybe explain why it shows values for some but not all, or perhaps it's losing data when it should be remembering it. My gut tells me there's a bug here. Or am I way off? I guess it's okay since we have a workaround to run that command when it happens, my brain is just wondering why it happened in the first place and how it could be prevented.
  • Network usage monitoring

    Feature Requests networking graphs monitoring
    9
    4 Votes
    9 Posts
    2k Views
    robiR
    @hillside502 yes, would be cool to map home networks and the upcoming Cloudron Multiserver.. and any ActivityPub App federations.
  • How do you monitor your VPS ?

    Discuss monitoring zabbix graphs
    20
    1
    2 Votes
    20 Posts
    3k Views
    marcusquinnM
    @atrilahiji That'd be the tax monitors, they soon format c: your bank account if you stop pinging their servers
  • 1 Votes
    16 Posts
    2k Views
    robiR
    @d19dotca Yes, the limits are there to protect against the noisy neighbor problem which exists when many processes are competing for the same resources and ONE uses up more than their fair share. Technically we could have all 30 Apps be set to 1+GB on a 16GB RAM system and it would work fine until one App behaved badly. Then the system would be in trouble as the OOM killer would select a potentially critical service to kill. With limits, the system is happy, and the killing happens in containers instead.
  • Graphite still not stable

    Unsolved Support graphs graphite services
    1
    0 Votes
    1 Posts
    367 Views
    No one has replied
  • Memory graph for Services, 50% RAM and 50% Swap.

    Solved Support graphs
    11
    1
    0 Votes
    11 Posts
    1k Views
    girishG
    @robi That's my understanding, yes. That it will persist to containers. The article I liked in the earlier comment has the sysctl command to set vm swappiness. But as mentioned earlier, fine tuning these things should be done after investigating and understanding those settings because they usually end up having unexpected side effects.
  • CPU usage breakdown?

    Solved Support cpu graphs contabo
    25
    4 Votes
    25 Posts
    4k Views
    P
    @girish now I've this: [image: sc.png]
  • Disk usage is not showing

    Solved Support graphs disk usage
    35
    1
    0 Votes
    35 Posts
    4k Views
    T
    I have a CIFS mounted, but it has fixed itself and appears to work normally now.
  • 0 Votes
    6 Posts
    1k Views
    girishG
    Just leaving a note for myself, but it's unclear why the issue got fixed after the update. After an app update, the container is recreated and the collectd config is regenerated. Maybe the collectd restart did the trick.
  • System memory visualization

    Discuss graphs memory feature-request
    3
    1 Votes
    3 Posts
    818 Views
    ruihildtR
    @nebulon Thanks for your reply. After thinking about it, the graph chosen is better to view memory usage (which fluctuate much more than disk). I would then suggest separating both information: keep the current graph for the app usage (the Y axis adapting to the app using the most memory) add a bar for total memory used, modelled on the total disk usage (could be a single colour for memory usage) [image: PI8ftjd.png] This would help maximize the amount of information you can visualize in one go and help detect spikes better.
  • Resizing Disks

    Support graphs disks storage
    3
    0 Votes
    3 Posts
    855 Views
    girishG
    @ice The Cloudron disk graphs is computed only twice a day. So, please check after atleast 12 hours of the disk resize.
  • Strange storage usage

    Support docker storage graphs
    7
    1
    0 Votes
    7 Posts
    1k Views
    girishG
    @smilebasti The /home/yellowtent/appsdata is the location of apps. This size seems to roughly match the nextcloud size. As for docker, you should not use du tools inside docker's image directories since they are overlays and the du tool is not smart enough to figure out the size correctly. Try docker system df to get a better idea about the actual size docker uses (this is what is reported in the graph as ~5GB). The volumes also link into appsdata so they might be double counted the du tools. To take a wild guess, maybe you were backing up to the file system for some time before you moved to NAS via SMB? If this was the case, then you should remove the old backups manually from /var/backups. You can just safely nuke all the timestamped directories and the snapshot directory inside it.
  • 0 Votes
    15 Posts
    2k Views
    scookeS
    @nebulon about 15-20 every second. When it stops there is a line box:apphealthmonitor app health: 28 alive / 4 dead. Nothing about accessing any sites though.
  • Memory and disk totals, how are they calculated?

    Discuss graphs
    9
    0 Votes
    9 Posts
    1k Views
    MooCloud_MattM
    Hello @girish, Just lost a lot of time on a bug related to storage and I then discover that what shows in the cloudron UI was in fact Binary, can be updated the label to the correct one with the "i" in-between letters, so that it's clear what unit of measurement is been used? KiB kibibyte MiB mebibyte GiB gibibyte I know that is a stupid thing to complain but it can save some time on understanding what's happening sometimes.
  • Errors on System Info page

    Solved Support graphs
    2
    3
    0 Votes
    2 Posts
    532 Views
    girishG
    @ruihildt Thanks for reporting. This is fixed in the coming release - https://git.cloudron.io/cloudron/box/-/blob/master/CHANGES#L1930
  • Disk graphs not loading for external disk mounts.

    Solved Support graphs
    11
    1
    0 Votes
    11 Posts
    2k Views
    girishG
    @ruihildt The issue in your case was different. There were so many apps that the query parameter limit was getting exceeded. This is fixed in next release. @necrevistonnezr this is most likely your issue as well!