-
Cloudron Install fails.
Solved -
Unable to install apps
Solved -
-
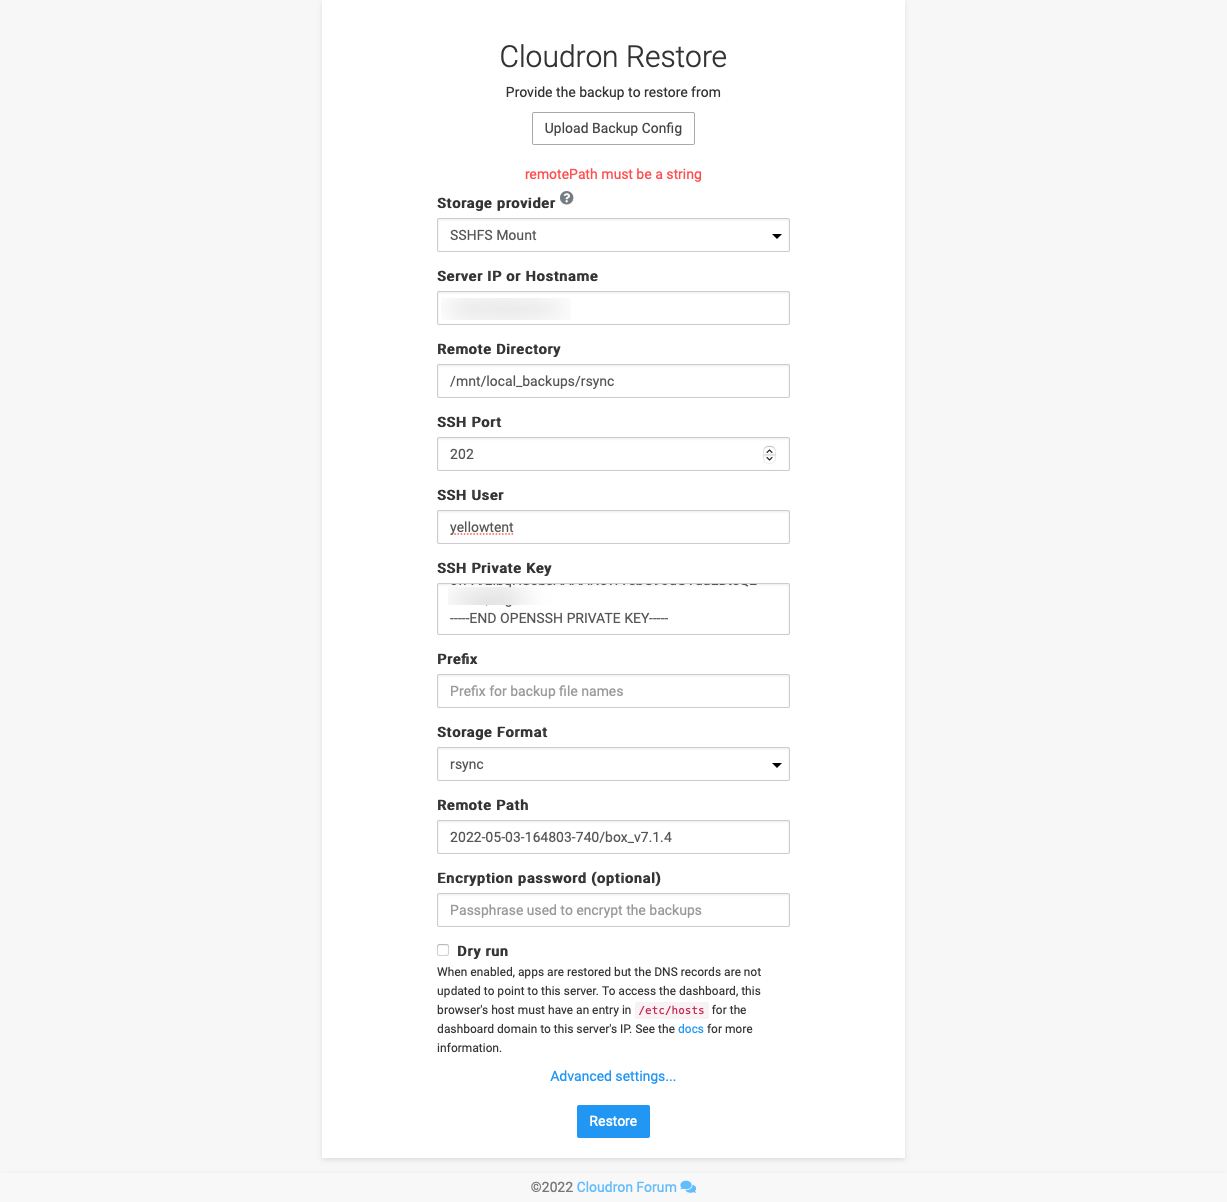
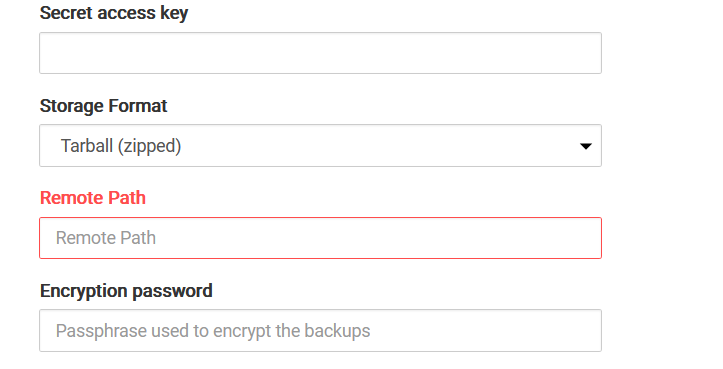
Failed to backup
Solved -
-
-
-
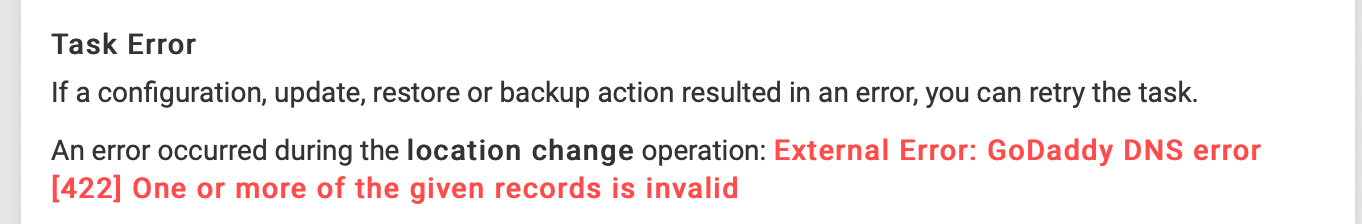
Godaddy Domain API error 422
Solved -
Waiting for DNS propagation
Solved -
-
Purchase Subscription
Solved -
-
-
-
-
-
Custom link in dashboard
Solved -
-
-
How does the memory management work with regards to "low on resources" message when deploying a new app?
Solved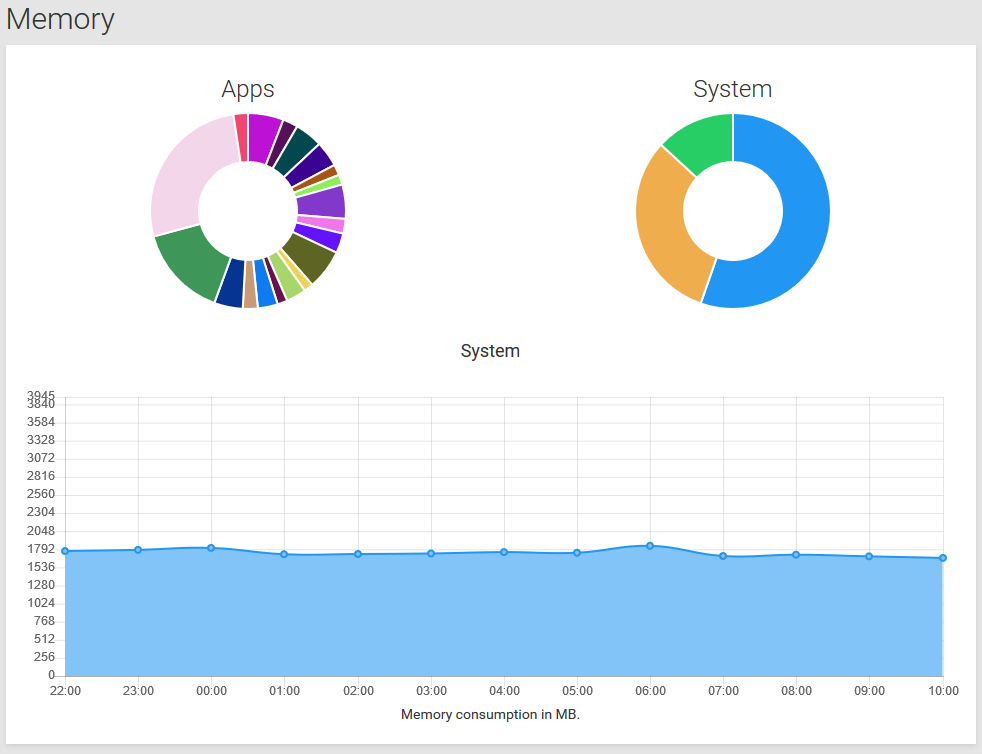 1
1